![]()
SELECTED DEMOGRAPHIC INDICATORS FOR JAPAN
National Institute of Population and Social Security Research
CONTENTS
- Table 1. Population Growth
- Table 2. Projection of Japanese Population
- Table 3. Population by Major Age Group
- Table 4. Projection of the Japanese Population by Major Age Group
- Table 5. Vital Statistics
- Table 6. Mean Age at First Marriage
- Table 7. Age- Specific Fertility Rates for Females
- Table 8. Age- Specific Fertility Rates for Married Women
- Table 9. Reproduction Rates for Females
- Table 10. Induced Abortions and Sterilization
- Table 11. Contraceptive Practice
- Table 12. Life Expectancy and the Number of Survivors at Selected Age
- Table 13. Age - Specific Mortality Rates by Sex
- Table 14. Death Rates by Cause
- Table 15. The Percentage of Deaths by Cause
- Table 16. Proportions of the Currently Married and Never Married Populations by Sex and Age Group
- Table 17. Population by Labor Force Status
- Table 18. Labor Force Participation Rate by age and Sex
- Table 19. Employed Persons by Major Industrial Sector
- Table 20. Employed Persons by Broad Group of Occupation
- Table 21. Employed Persons by Employment Status
- Table 22. Households and Household Members by Type of Household
- Table 23. Number and Percent Distribution of Households by Type of Family
- Table 24. Population Growth by Region
- Table 25. Population of Urban and Rural Areas
You can download all tables the above with Microsoft Excel by clicking .
.
Table 1. Population Growth

- Sources:
- Statistics Bureau, Management and Coordination Agency, Population Census of Japan for various years, and others. Unless specified, figures are calculated for whole Japan including Okinawa prefecture on October 1 of each year.
- Notes:
- 1)Estimated by the Statistics Bureau.
- 2)As of January 29 by the lunar calendar.
- 3)As of January 1.
- 4)Excluding Okinawa.
- 2)As of January 29 by the lunar calendar.
Table 2. Projection of Japanese Population

- Source:
- National Institute of Population and Social Security Research, Ministry of Health and Welfare, Population Projections for Japan, January 1997.
- Notes:
- Medium variant projections (as of October 1).
- 1)Population census of Japan.
Table 3. Population by Major Age Group

- Sources:
- Statistics Bureau, Management and Coordination Agency, Population Census of Japan for various years, and others.
- Notes:
- 1)Population estimate by the Statistics Bureau.
- 2)Excluding Okinawa Prefecture.
Table 4. Projection of the Japanese Population by Major Age Group
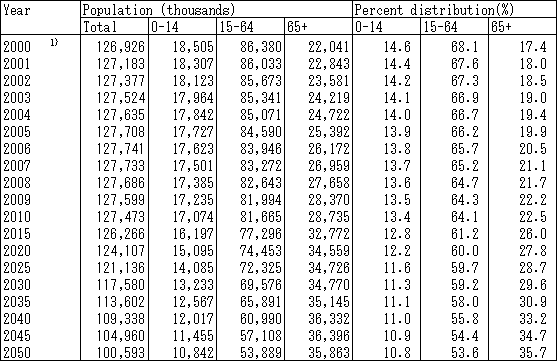
- Source:
- National Institute of Population and Social Security Research, Ministry of Health and Welfare, Population Projections for Japan, January 1997.
- Notes:
- Medium variant projections (as of October 1).
- 1)Population census of Japan.
Table 5. Vital Statistics
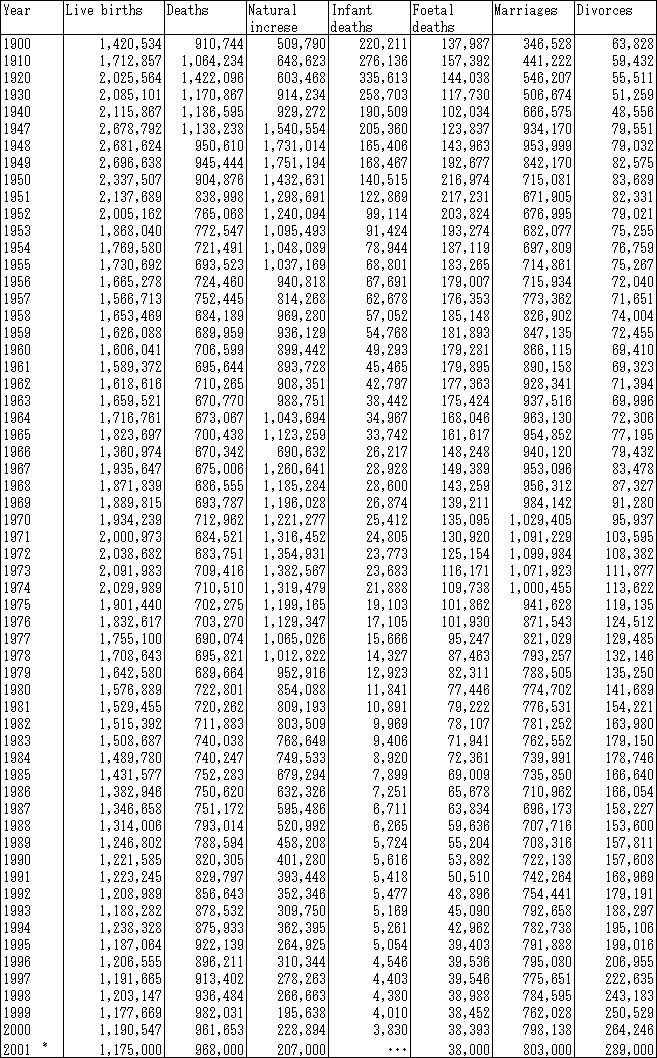
- Source:
- Statistics and Information Department, Minister's Secretariat, Ministry of Health, Labour and Welfare, Vital Statistics of Japan.
- Note:
- For 1947-72; Excluding Okinawa prefecture.
- *Annual projections.
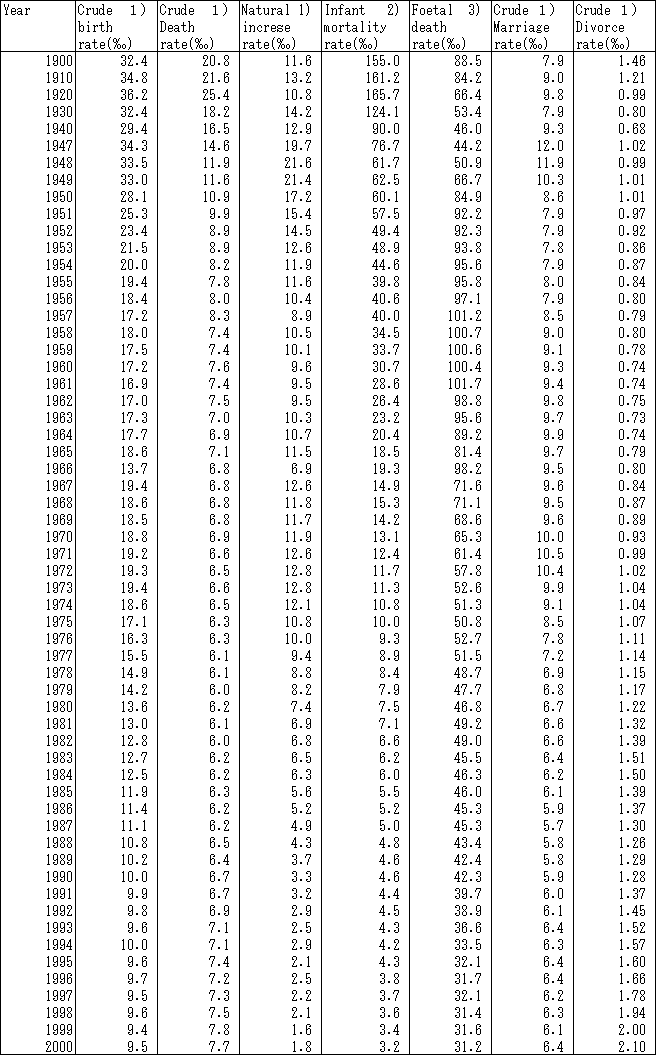
- Source:
- Statistics and Information Department, Minister's Secretariat,Ministry of Health and Welfare, Vital Statistics of Japan.
- Notes:
- For 1947-1972; Excluding Okinawa Prefecture.
- 1)Per 1,000 total population.
- 2)Per 1,000 live births.
- 3)Per 1,000 births including foetal deaths.
- 1)Per 1,000 total population.
Table 6. Mean Age at First Marriage
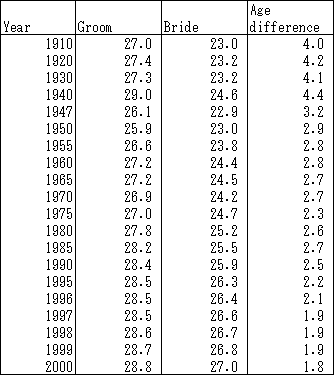
- Source:
- Vital Statistics of Japan.
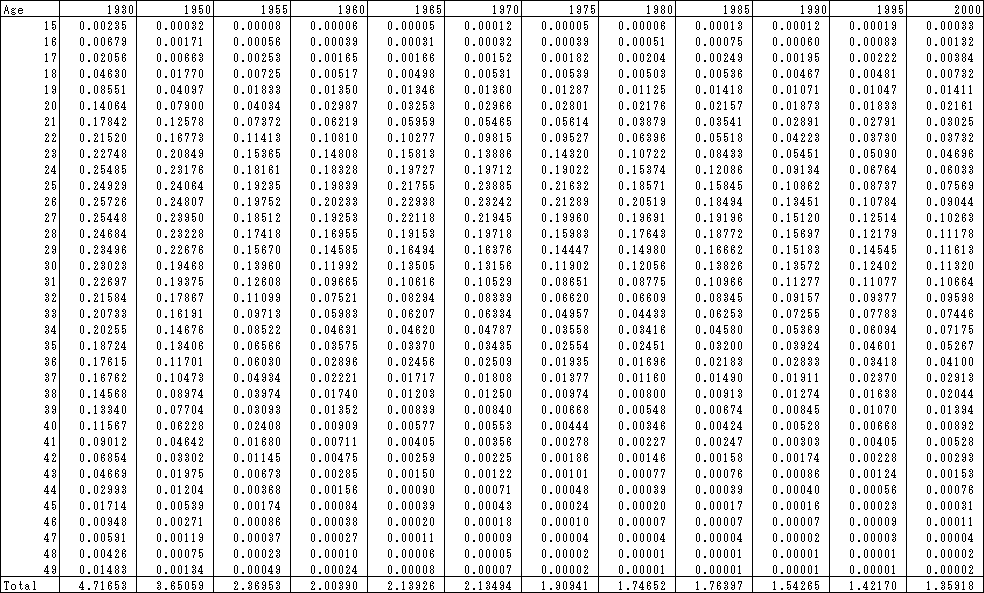
Table 7. Age- Specific Fertility Rates for Females

- Source:
- Statistics and Information Department, Minister's Secretariat, Ministry of Health, Labour and Welfare, Vital Statistics of Japan.
- Notes:
- For 1950-70; Excliding Okinawa Prefecture.
- Rates are defined as the number of live births occuring to 1,000 women in each age group.
- 1) Rate computed for women aged 15-49.
- Rates are defined as the number of live births occuring to 1,000 women in each age group.
- Source:
- National Institute of Population and Social Security Research, Latest Demographic Statistics.
Table 8. Age- Specific Fertility Rates for Married Women

- Source:
- National Institute of Population and Social Security Research, Latest Demographic Statistics. Notes: Rates are defined as the number of live births occuring to 1,000 married women in each age group.
- 1)Rates computed for married women aged 15-49.
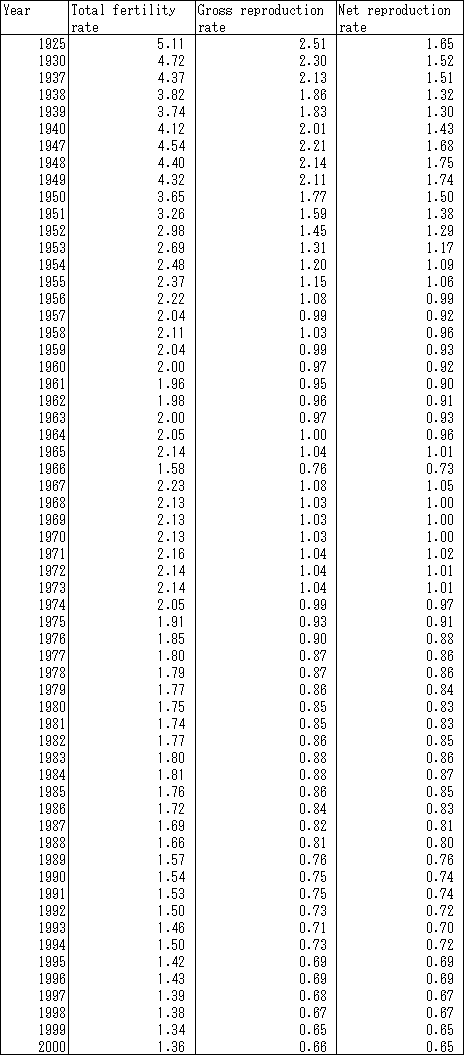
Table 9. Reproduction Rates for Females
- Source:
- National Institute of Population and Social Security Research, Latest Demographic Statistics.
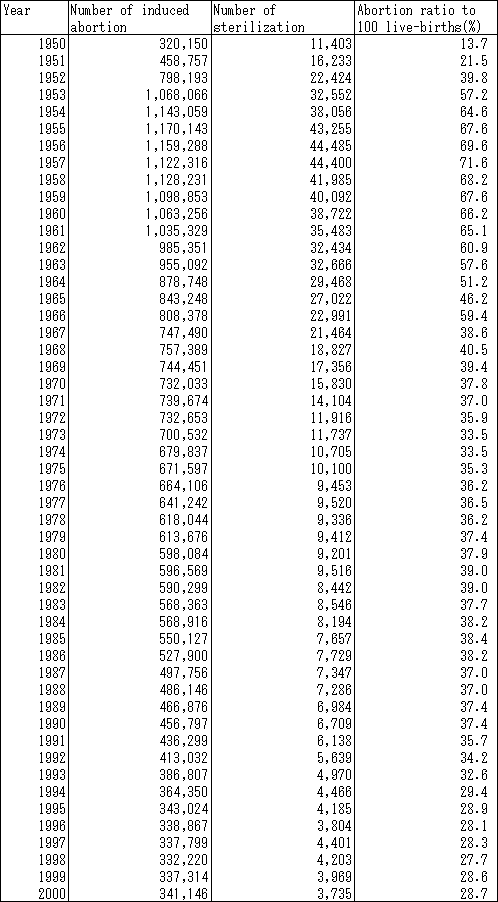
Table 10. Induced Abortions and Sterilization
- Source:
- Statistics and Information Department, Ministry of Health and Welfare, Statistical Report on Safe Motherhhod.
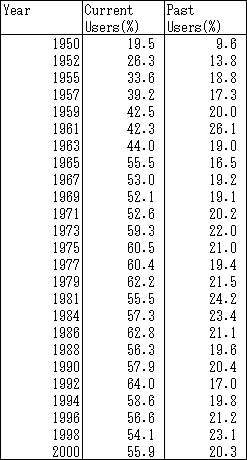
Table 11. Contraceptive Practice
- Source:
- The Population Problems Research Council, The Mainichi News Papers, Summary of National Survey of Family Plannning.
- Note:
- The Percentage of women who are currently practicing or have ever practiced contraception under age 50.
Table 12. Life Expectancy and the Number of Survivors at Selected Age
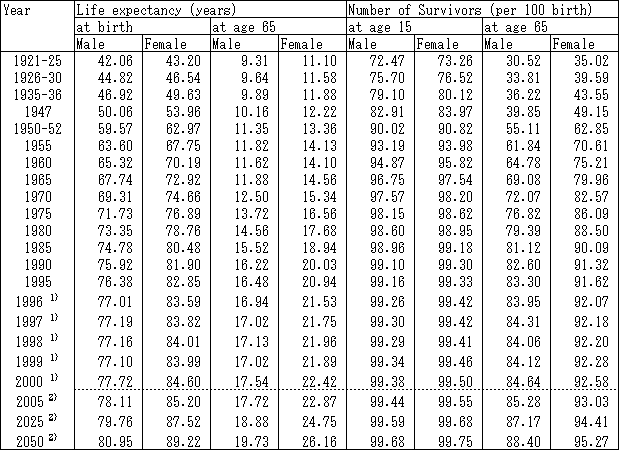
- Sources:
- Ministry of Health and Welfare, The 18th Life Tables, and Abridged Life Tables for 1996 and 1997.
- Note:
- 1)Abridged Life Table.
Table 13. Age - Specific Mortality Rates by Sex
(‰)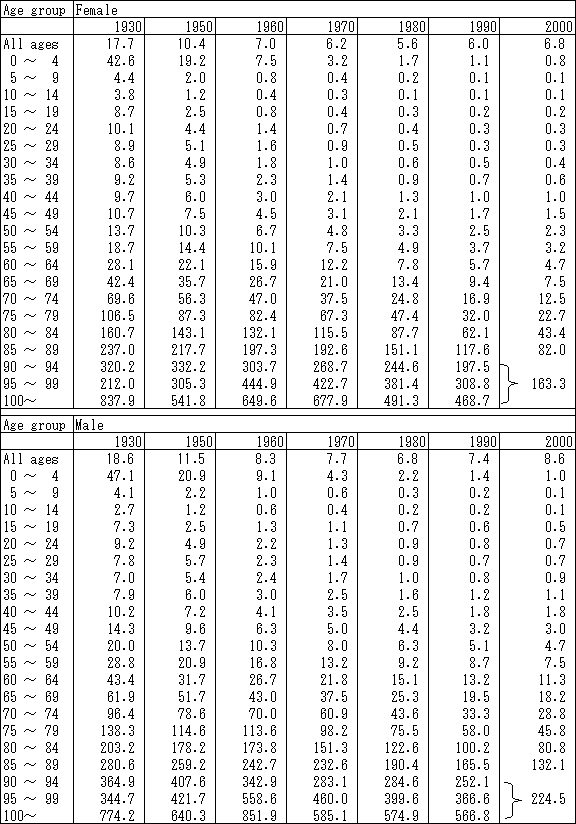
- Source:
- Vital Statistics of Japan.
- * Provisional.
Table 14. Death Rates by Cause
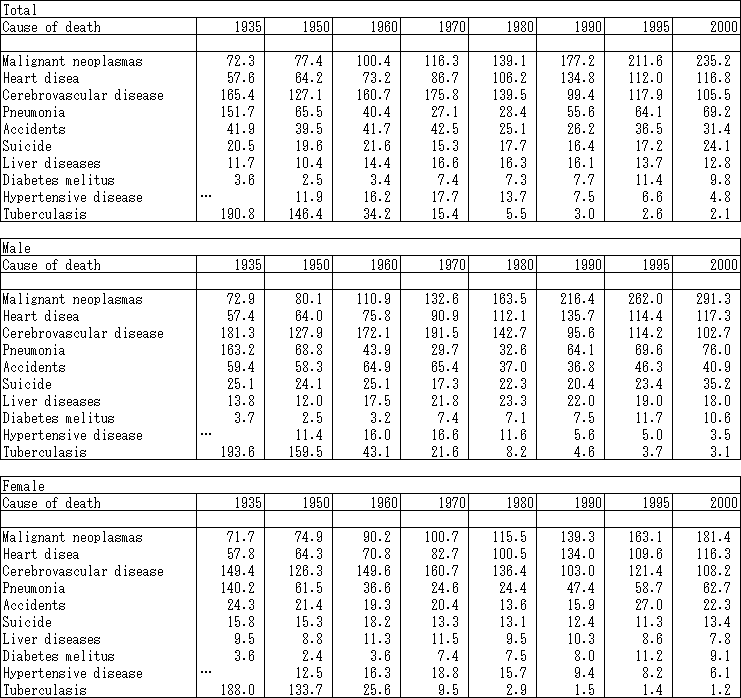
- Source:
- Vital Statistics of Japan.
- Note:
- Due to change in the category of cause of death, the distribution of percentage may fluctuate between years.
Table 15. The Percentage of Deaths by Cause
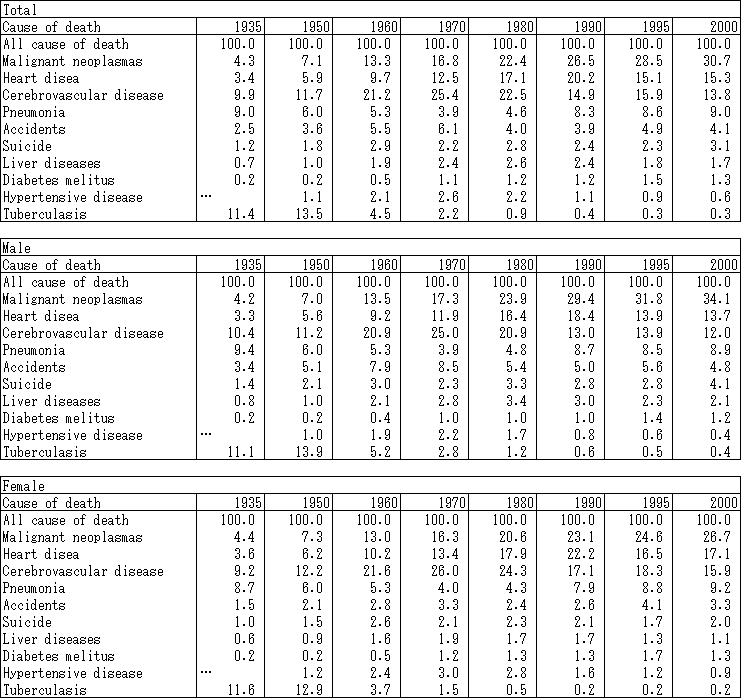
- Source:
- Vital Statistics of Japan.
Table 16. Proportions of the Currently Married and Never Married Populations by Sex and Age Group
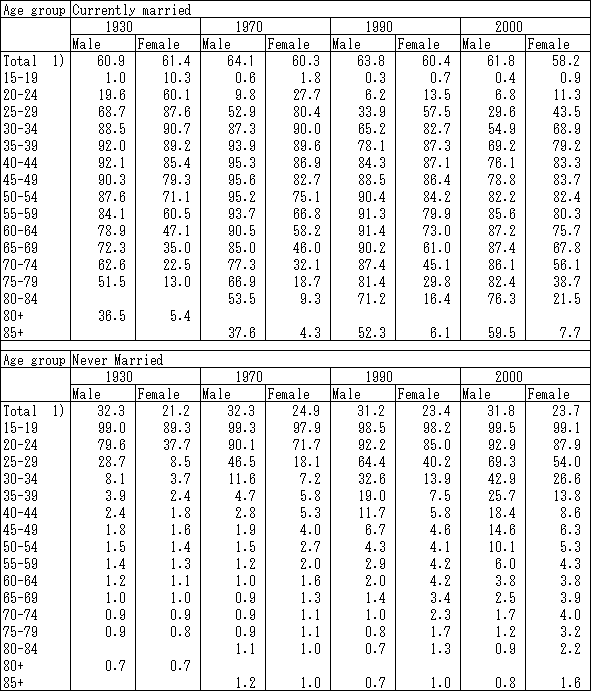
- Source:
- Population Census of Japan.
- Notes:
- Percent distribution by marital status.
- 1)Population 15 years old and over.
Table 17. Population by Labor Force Status

- Source:
- Population Census of Japan.
- Note:
- 1)Including people whose labor force status is not reported.
Table 18. Labor Force Participation Rate by age and Sex
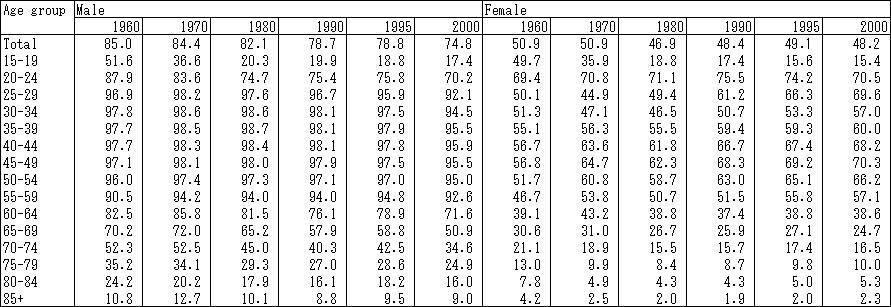
- Source:
- Population Census of Japan.
Table 19. Employed Persons by Major Industrial Sector
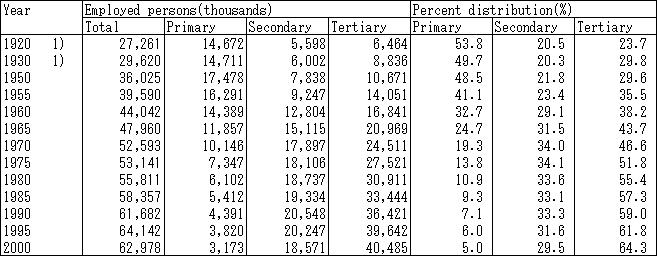
- Source:
- Population Census of Japan.
- Notes:
- The total number includes those who do not belong to any of the following three categories.
- 1) Gainful workers of all ages.
- 2) 15 years old and over.
- 1) Gainful workers of all ages.
Table 20. Employed Persons by Broad Group of Occupation

- Source:
- Population Census of Japan.
- Notes:
- Employed persons 15 years old and over. The total number includes those occupations that do not belong to any of the following four categories.
Table 21. Employed Persons by Employment Status
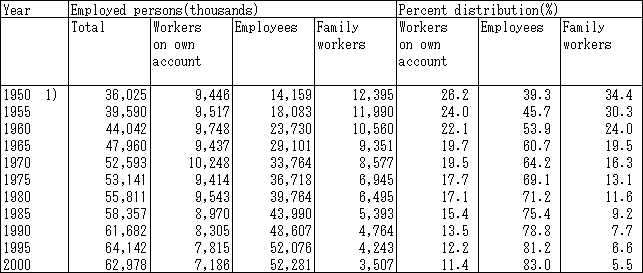
- Source:
- Population Census of Japan.
- Notes:
- Employed persons 15 years old and over.
- 1)Employed persons 14 years old and over.
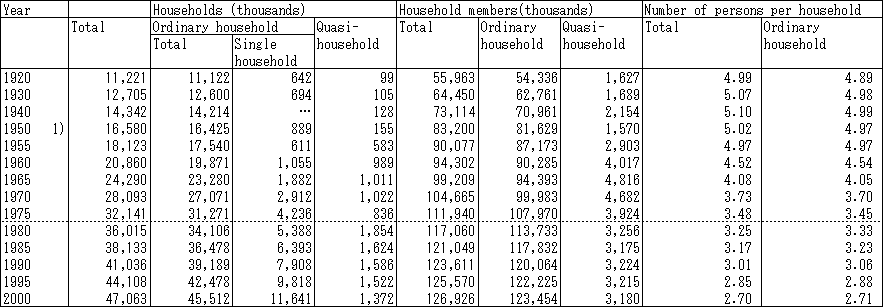
Table 22. Households and Household Members by Type of Household
- Source:
- Population Census of Japan.
- Notes:
- The total number includes those households whose types were not reported.
- 1)Excluding Okinawa Prefecture.
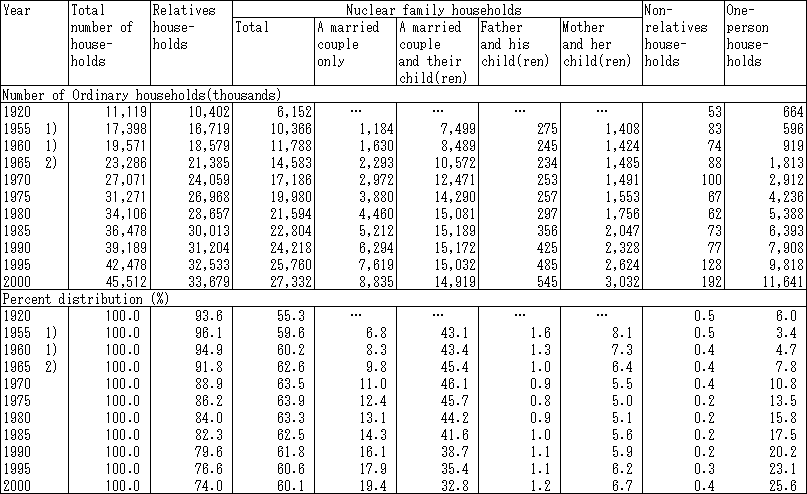
Table 23. Number and Percent Distribution of Households by Type of Family
- Source:
- Population Census of Japan.
- Notes:
- The definition of households has been changed, so that special attention is necessary for time series comparison.
- 1) 1% sample tabulation.
- 2) Excluding Okinawa Prefecture.
- 1) 1% sample tabulation.
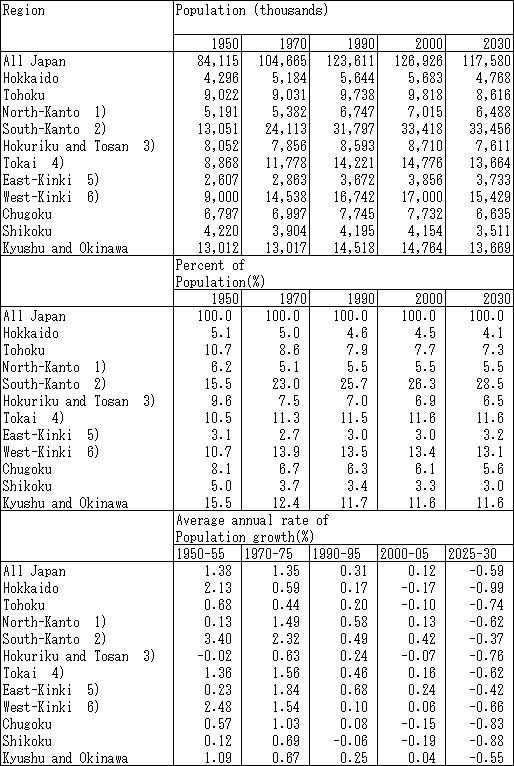
Table 24. Population Growth by Region
- Source:
- Population Census of Japan. The Population Projections by Prefectures 1995 - 2025.
- Notes:
- 1)Including the prefectures of Ibaraki, Tochigi and Gumma.
- 2)Saitama, Chiba, Tokyo and Kanagawa.
- 3)Niigata, Toyama, Ishikawa, Fukui, Yamanashi and Nagano.
- 4)Gifu, Shizuoka, Aichi and Mie.
- 5)Shiga, Nara and Wakayama.
- 6)Kyoto, Osaka and Hyogo.
- 2)Saitama, Chiba, Tokyo and Kanagawa.
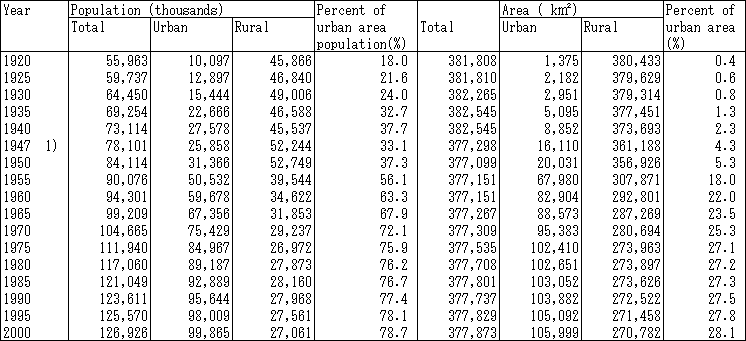
Table 25. Population of Urban and Rural Areas
- Source:
- Poulation Census of Japan.
- Notes:
- The terms urban and rural indicate the administratively defined “shi” and “gun” areas.
- 1) Excluding Okinawa.


