Appendix: International comparisons
(ILO standards)
Note for use of the appendix:
The appendix is divided into two parts. The international comparisons
compiled by the ILO are shown on pages 29-31. Another international
comparison compiled by the OECD is shown on pages 32-34. The Cost
of Social Security in Japan is compiled according to the ILO standards.
However, updates to the ILO database have been delayed for some time
and the database remains old. Therefore, the OECD Social Expenditure
Database is published for reference to more recent trends. Definitions
in the two data are similar but not the same. In particular, the OECD
reports expenditures more widely, which means the OECD includes the
cost for investment in the facilities and equipment as well. Please
be aware that Japan's data for the OECD exceeds that of the ILO for
this reason.
Countries reporting the 19th investigation are limited as in the last
year and, therefore, the most recent data in 1996 was published in
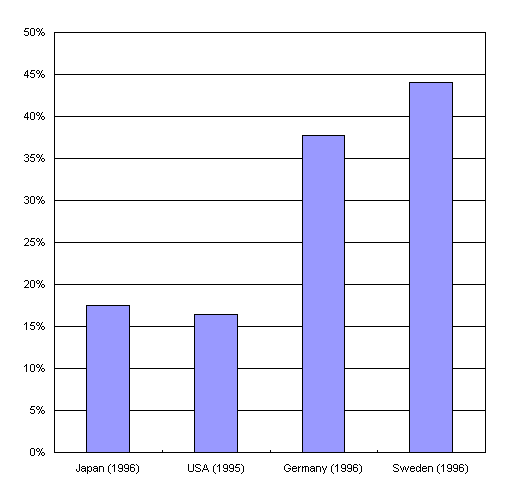
Figure 1.
Figure 1 International comparison of Social
Security Expenditure as a percentage of National Income
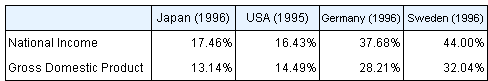
Table 1 International comparison of Social
Security Expenditure as a percentage of National Income and Gross
Domestic Product
Sources:
The values of National Income and the GDP for
Japan were quoted from the “Annual Report on National
Accounts in the fiscal year 2004” by the Cabinet Office’s
Economy Social Research Institute (Same applies hereinafter).
The values of national income and the GDP for the United States,
Germany and Sweden were quoted from “National Account of OECD
countries: Main Aggregates, vol. 1, OECD 2004” (Same applies hereinafter).
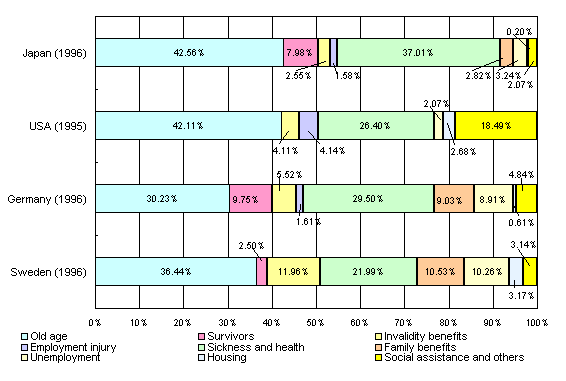
Figure 2 International comparison of Social
Security Revenue by functional category
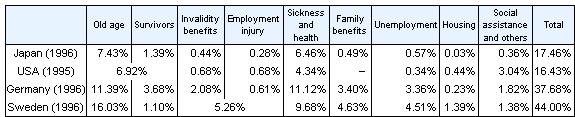
Table 2 International comparison of Social
Security Expenditure by functional category as a percentage of National
Income
Notes:
The United States includes “Survivors” in the
“Old age” category.
Sweden includes “Employment injury” in the “Invalidity benefits”
category.
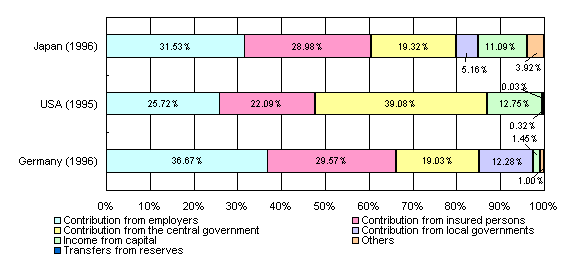
Figure 3 International comparison of Social
Security Revenue by source
Note:
As for the United States, the figure is the
sum of the contributions from the federal government and from
well as local governments.
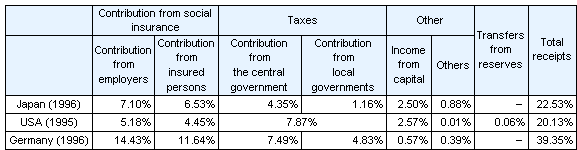
Table 3 International comparison of Social Security
Revenue as percentage of National Income
Note:
The United States has not separated the general
government into the federal and local governments.