As of October 1st 2012, the population of Japan counted 127,515,000, shrunk by 284,000 from the previous year. Population decline has become a reality1. In 1920 when the first population census was carried out, the population of Japan was 56 million. The population growth continued until around 2010, and then it would decline almost at the same pace as it increased, according to the population projection of IPSS2. Japan is the most aged society in the world, with 24.1% of the population aged more than 65 years old in 2012, and this rate would further increase to 40% in 2060, and the increase of “oldest-old”, namely aged 75 and more would be more than double from 11% in 2010 to 27% in 2060. Naturally, the young people (aged 0-19), comprising 40% of the total population in 1960 is shrinking to 18% in 2010, and 13% in 2060.
Social Security in Japan 2014
Chapter 1 Overview of Population Trends in Japan
1.1 Total population and change of age structure
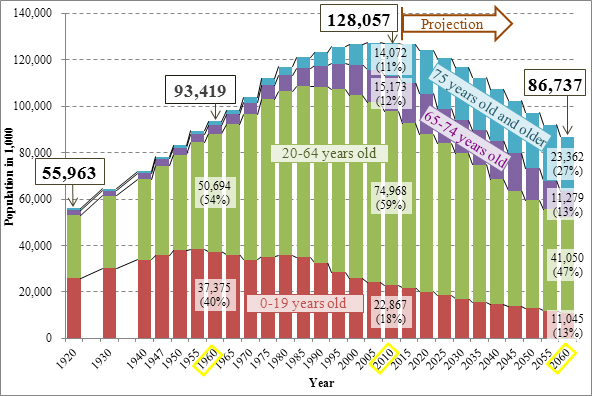
For the data from 2015, “Population Projections for Japan”, IPSS (see footnote)
1.2 Vital statistics trend
The change of Japanese population is the result of the fertility and mortality evolution. Before the end of the World War II (in 1945), the level of fertility and mortality was high. The total fertility rate was as high as 5.11 in 1925, but steadily decreased until 1937, followed by significant fluctuation due to the war and population policies. As for the mortality, the improvement since 1920 is notable especially for the level of infant mortality and maternal mortality. The extension of life of the Japanese continues up to now and the life expectancy is one of the highest in the world at 79.94 for males and 86.41 for females in 2012.
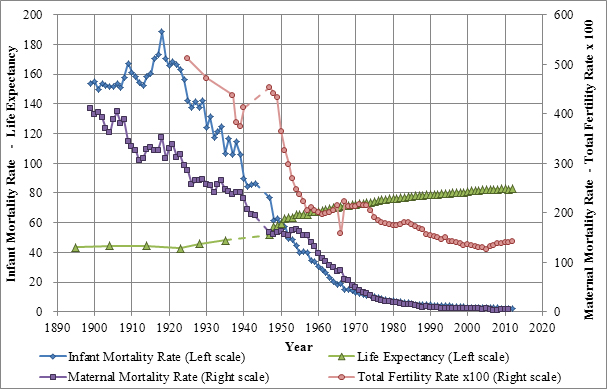
A sharp decline of total fertility rate was observed in 1966, which was due to the Year of the Fire Horse. The traditional belief that girls born in this year would eat up the husband refrained parents not to have babies this year. Customs, superstition, tradition still dominated the reproductive behaviors of Japanese even during the latter half of the 20th century.
1.3 Population distribution – centralization and decentralization
The Japanese archipelago consists of the main island (Honshu) and the three major islands (Kyushu, Shikoku, Hokkaido) with 6,848 lesser islands, totaling 377,960 km2 in area. Administratively it is divided into 47 prefectures (都道府県To-Do-Fu-Ken) and subdivided into 1,742 municipalities3 (市区町村 Shi-Ku-Cho-Son) as of 1 Jan. 2013. In 1889 when municipality was institutionalized by law, there were 13,386 municipalities, but due to population urbanization along with domestic migration, the number of municipalities has been reduced. The population concentration proceeds and now the three Major Metropolitan Areas namely Kanto (around Tokyo), Kinki (Around Kyoto, Osaka), and Chukyo (around Nagoya) contain 51 % of total population of Japan.
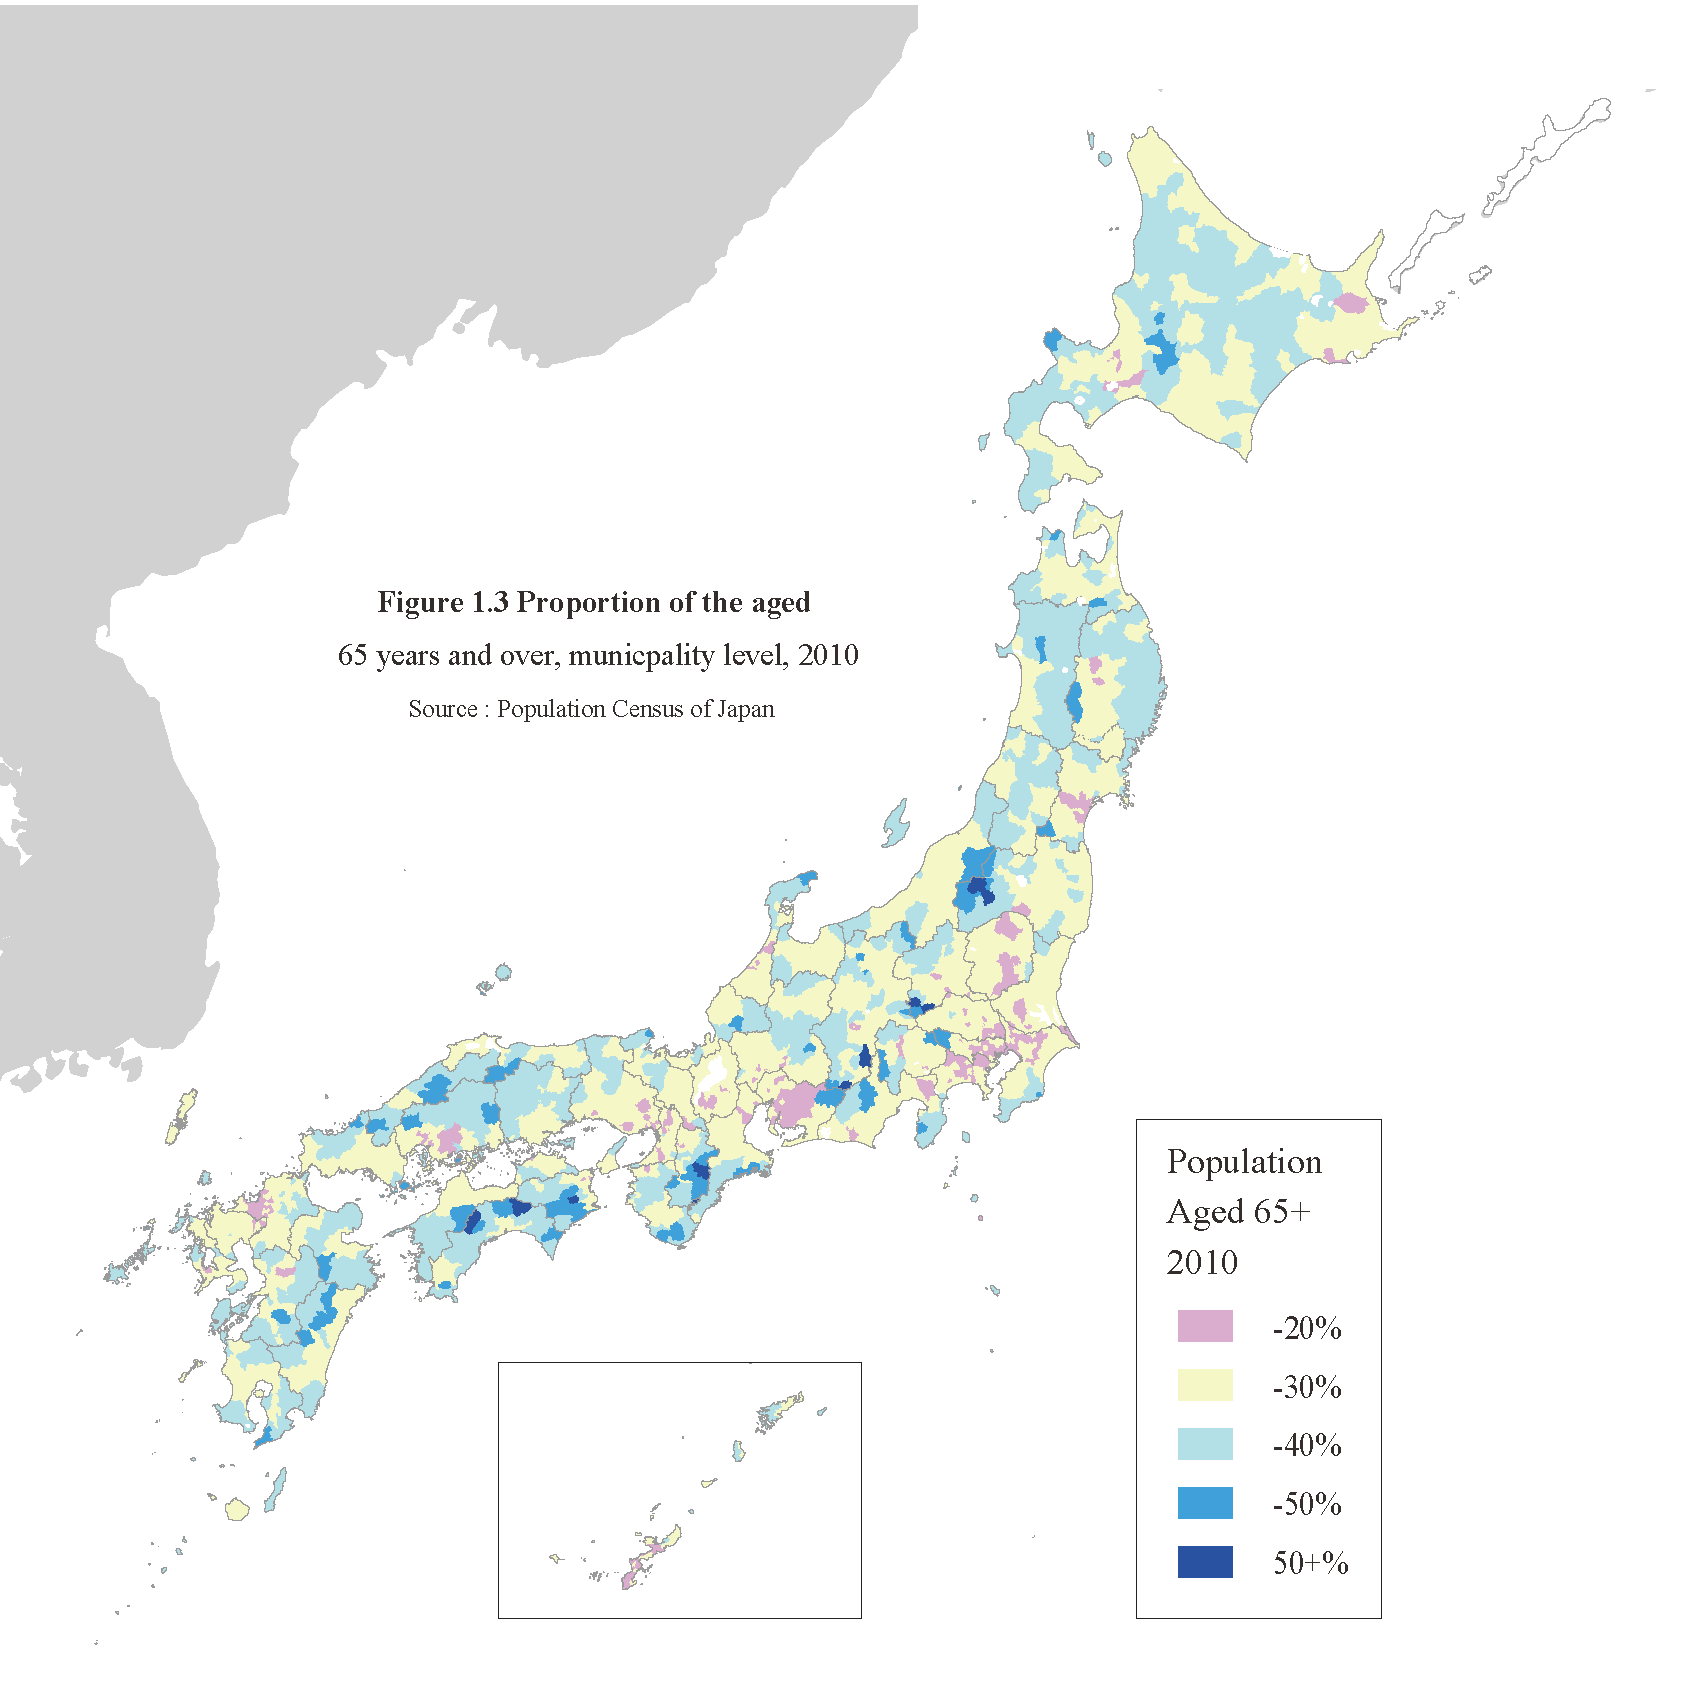
The population aging is different from municipality to municipality mostly due to domestic emigration of younger people to urban areas. As shown in Figure 1.3, municipalities in urban areas have much less proportion of the aged than in rural areas.
1.4 Family structure
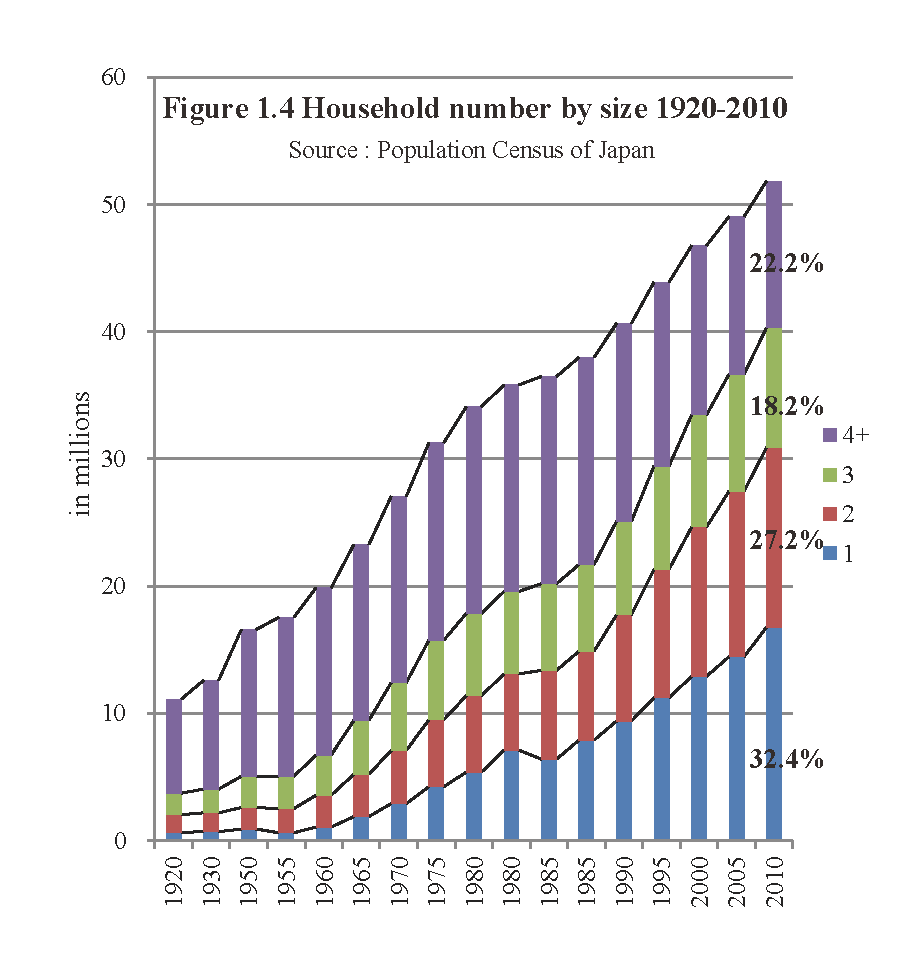
The Japanese family structure changes through history. As an agrarian society in 19th century, when 88% of the working population were in the agricultural, forestry, and fishing sectors4, a family was a production unit, and normally large, with more than two generations. The Civil Code enacted in 1898 institutionalized ie (family) system and authorized the head of the household, mostly the eldest male sibling, to be fully responsible for the family affairs. After the WWII, the ie system was gradually transformed to the nuclear family, with fixed role of the husband at work, the wife at home to take care of the children. Along with the global trend of empowerment of women, the Equal Employment Opportunity Law was enacted in 1986 and roles of women and men were transformed to a direction of individualization of family. Recently, even though the total population is decreasing, the number of households is still increasing due to the increase of single households, mainly with young and middle aged people who are not married or divorced or elderly who have lost their spouse (Figure 1.4). The average number of household members keeps on decreasing from 4.99 in 1920 to 2.46 in 2010.
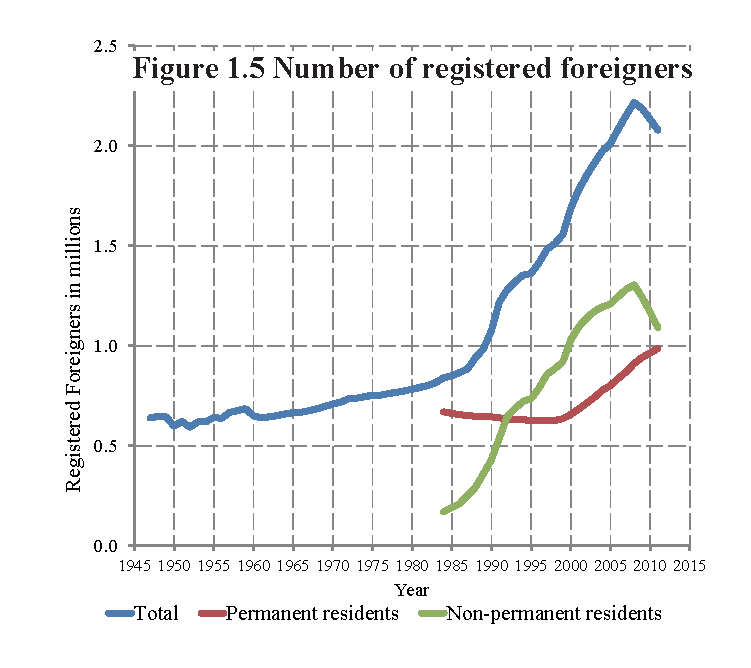
1.5 International migrants
Although the proportion of foreigners is 1.6% of the total population of Japan, which is much lower than the rate of other industrialized countries, the number of foreigners steadily increased until 2008. Since then, the total number of foreigners decreased due to the global economic crisis and the Great East Japan Earthquake, which hit Tohoku in 2011. However, permanent foreign residents keep on increasing, to a level close to 1 million in 2011 (Figure 1.5).
1.6 Population data sources
The correct statistics on population is the prerequisite for good governance and policy formulation. In Japan, there are three sources of population statistics, namely Population Census, Basic Resident Registration, and Family register (戸籍 Koseki). The Population Census has been organized since 1920 and every five years, with wider range of questions asked every ten years. The registration based population statistics is used to estimate yearly population figures. Family register, the East Asian traditional population registration system, was re-instated in Japan since 1871 by law, and now used as personal identification in conjunction with the family status.
As for the vital statistics, since 1872, each birth, death and marriage of people living in Japan has been registered at the municipality level and compiled at the national level. Together with various government surveys including those carried out by IPSS, population information is gathered, used, and disseminated for everybody through the internet, on web sites such as ; www.e-stat.go.jp or www.ipss.go.jp .
1. “Current Population Estimates as of October 1, 2012”, Statistics Bureau, Ministry of Internal Affairs and Communications, http://www.stat.go.jp/english/data/jinsui/2012np/index.htm
2. “Population Projections for Japan (January 2012), IPSS, https://www.ipss.go.jp/site-ad/index_english/esuikei/gh2401e.asp
3. Local Authorities Systems Development Center, https://www.lasdec.or.jp/cms/1,19,14,151.html
4. Toshiko Himeoka (2008) “Changes in family structure”, in The Demographic Challenge – A Handbook about Japan, Florian Coulmas et al. ed. Brill,