|
 |
|
|
| (1) |
|
Social Expenditure
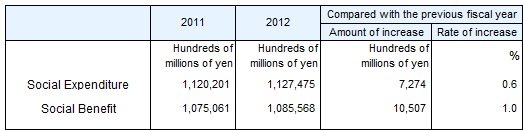
- The total amount of Social Expenditure in fiscal year 2012 was 112,747.5 billion yen.
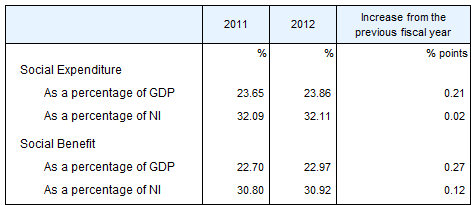
- Social Expenditure increased by 0.6% in fiscal year 2012 compared with the previous year. The percentage share of the Gross Domestic Product(GDP) was 23.86%.
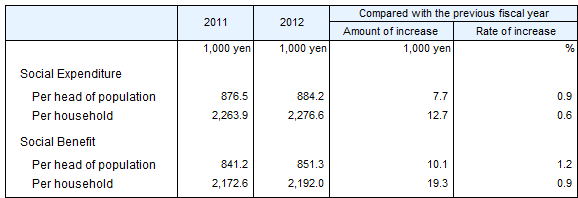
- Average Social Expenditure per head of population was 884,200 yen, and the average expenditure per household was 2,276,600 yen.
|
| (2) |
|
Social Benefit
- The total amount of Social Benefit was 108,556.8 billion yen.
- Social Benefit increased by 1.0% in fiscal year 2012 compared with the previous fiscal year. The percentage share of the GDP was 22.97%.
- Average Social Benefit per head of population was 851,300 yen, and the average expenditure per household was 2,192,000 yen.
|
Table 1.Total amount of Social Expenditure and Social Benefit
Note: |
Social Expenditure includes, in addition to Social Benefit, expenditure not directly spent on individuals such as expenditure on equipping facilities. Refer to the Appendix 2 for more details. |
Table 2. Social Expenditure and Social Benefit as a percentage of GDP and NI
Source: |
GDP and NI: "Annual Report on the National Accounts Statistics 2014" (Cabinet Office, Government of Japan). Hereafer the same.
|
Table 3. Social Expenditure and Social Benefit per head of population and household
Note: |
Social Expenditure per household=(Average number of household member in households)×Social Expenditure per head of population. The same method was used to calculate Social Benefit per household.
|
Source: |
Population - "Current Population Estimates as of October 1, 2012", Statistics Bureau, Ministry of Internal Affairs and Communications
Average number of people in households - "Comprehensive Survey of Living Condition 2012", Ministry of Health, Labour and Welfare
|
|