|
 |
 |
 |
| ( i ) |
|
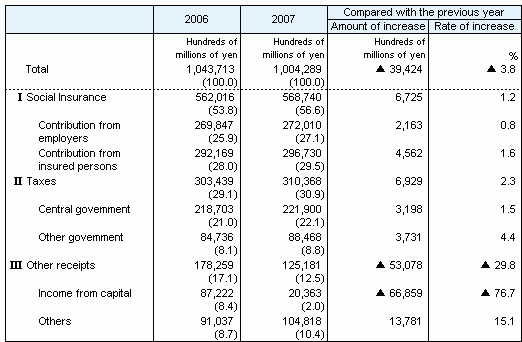
Percentages in each category indicate that Social Insurance is 56.6%, Tax is 30.9%, and Other Receipts is 12.5% of the total.
|
| ( ii ) |
|
Revenue has decreased 3.8% as compared to the previous fiscal year.
|
Table 7 Social Security Revenue by source,
fiscal years 2006 and 2007

| Notes: |
1. |
( ) The ratio to the total is expressed as a percentage. |
|
2. |
“Other receipts”, where “Income from capital” included, the reserves and capital gain from the employees’ pension funds and others are evaluated as current price of value. “Others” includes “Transfers from reserves”.
|
|
3. |
The receipts from the National Health Insurance joint performance of tasks are moved from the category “Other government” of “Taxes” to “Other” of “Other income” retrospectively upon careful reexamination of the nature.
|
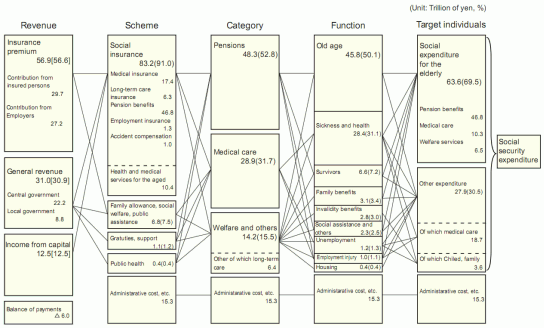
Figure 3 Social Security Expenditure
by revenue, scheme, category, function and target individuals,
fiscal year 2007

|
Notes:
|
1.
|
“Child, family” refers to medical insurance in the form of a lump sum maternity allowance and child-rearing allowance, employment insurance in the form of parental leave allowance, day-care facilities administration costs and single parent family and disabled child allowance.
|
|
|
2.
|
Fiscal year 2007 Social Security Revenue amounted to 100.4 trillion yen (excluding transfer from other systems). The figure in square brackets [ ] represents the ratio of the Social Security Revenue total.
|
|
|
3.
|
Fiscal year 2007 Social Security Expenditure amounted to 91.4 trillion yen. The figure in parentheses ( ) represents the ratio of the Social Security Expenditure total.
|
|