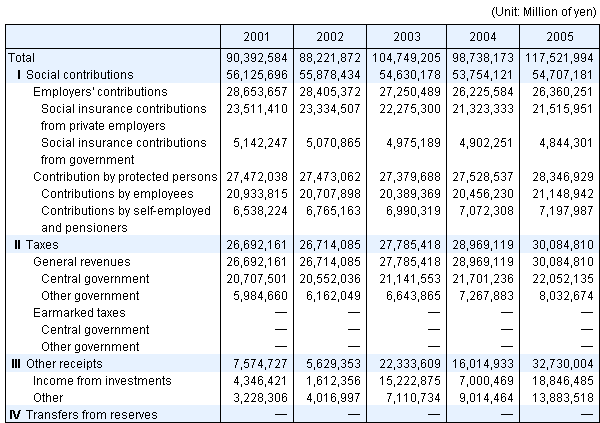
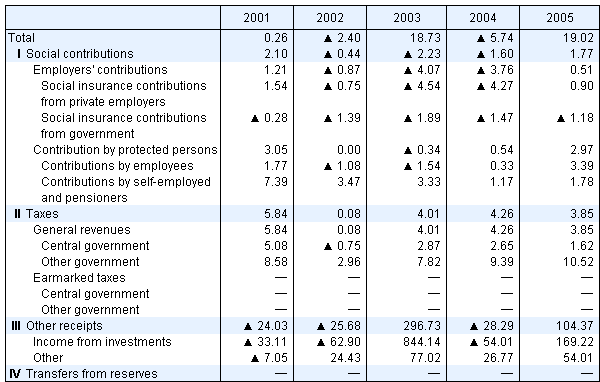
Table 11 Social Security Revenue by source,
fiscal years 2001-2005

Compared with the previous year (%)

Note: |
Table 11 has been calculated in accordance
with the standards of the ILO’s “The Cost of Social
Security 19th International Inquiry” (excluding
transfers from other schemes).
|
Download the following >> |
Return to the Contents
Return to the top page of The Cost of Social Security in Japan
