|
1.
|
Social Security Expenditure in fiscal year
2003 was 84,266.8 billion yen.
|
|
 |
 |
 |
| ( i ) |
|
Of the three categories,
Medical care was estimated at 26,615.4 billion yen,
accounting for 31.6 percent of the total; Pensions
was 44,784.5 billion yen for a total share of 53.1 percent.
Welfare & Others was 12,866.9 billion yen for a total
share of 15.3 percent. |
| ( ii ) |
|
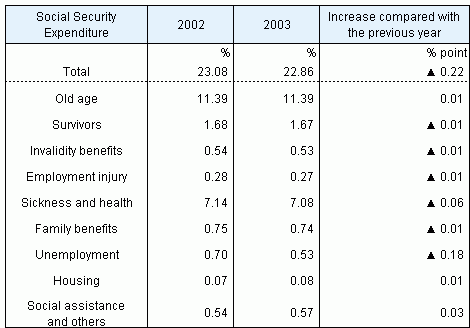
Social Security Expenditure
increased by 0.8 percent in fiscal year 2003. The percentage
share of the National Income was 22.86 percent. |
| ( iii ) |
|
Social Security Expenditure
per head of population was estimated at 660,300 yen, and
the average expenditure per household was 1,819,300 yen. |
Table 1 Social Security Expenditure
by category, fiscal years 2002 and 2003

Note: ( ) The ratio to the total is expressed as a percentage.
Table 2 Social Security Expenditure
by category as a percentage of National Income

Table 3 Social Security Expenditure
per head of population and per household, fiscal years 2002
and 2003

|
Notes:
|
Social Security Expenditure per household
= (Total number of people in households/Total number of
households) × Social Security Expenditure per head
of population.
|
Figure 1 Social Security Expenditure
by category, fiscal years 1970-2003

|
|
2.
|
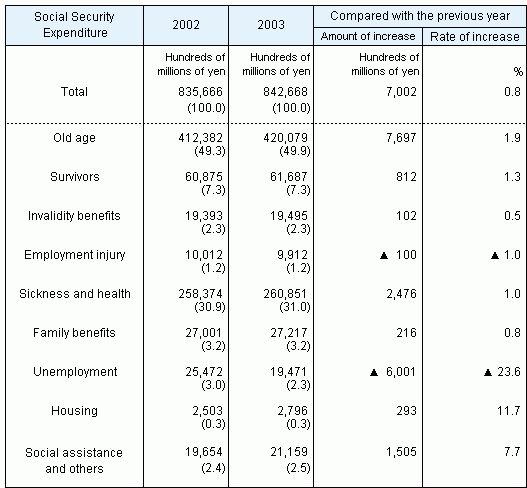
As can be seen in Table 4 below showing Social
Security Expenditure by functional category, “Old age”
heads the list with 49.9% of the total, followed by “Sickness
and health” at 31.0%. These two functional categories make up
approximately 80.9% of the entire Social Security Expenditure.
The other functional categories and their percentages of the
total are “Survivors” (7.3%), “Family benefits”
(3.2%), “Social assistance and others”
(2.5%), “Invalidity benefits” (2.3%), “Unemployment”
(2.3%), “Employment injury” (1.2%) and “Housing”
(0.3%).
|
Table 4 Social Security Expenditure by functional
category, fiscal years 2002 and 2003

|
Notes:
|
1. ( ) The ratio to the total is expressed
as a percentage.
|
|
|
2. Refer to ‘Reference’
for more details about functional classifications. |
Table 5 Social Security Expenditure by functional
category as a percentage of National Income

Figure 2 Social Security Expenditure by
functional category, fiscal years 1999-2003

|
3.
|
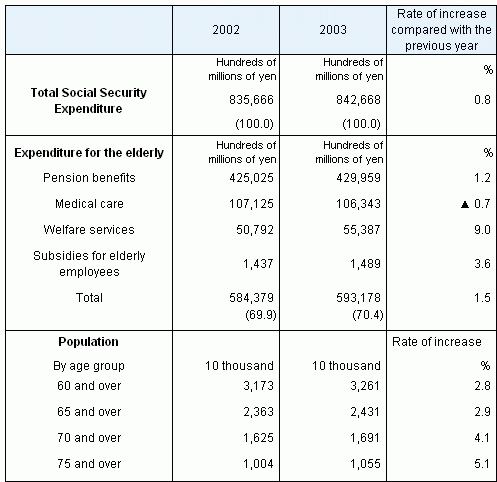
Social Security Expenditure for the elderly
(i.e., retirement pensions, medical care for the aged, welfare
services for the aged) was 59,317.8 billion yen. Its share of
Social Security Expenditure was 70.4 percent.
|
Table 6 Social Security Expenditure for
the elderly, fiscal years 2002 and 2003

|
Notes:
|
1.
|
The ratio to the total Social Security Expenditure
is expressed as a percentage.
|
|
|
2.
|
Health and medical services expenditure for
the aged consists of expenditures concerning measures for care
control, the in-home welfare service expense not covered by
long-term care insurance, etc.
|
| |
3.
|
Elderly employment maintenance benefits provide
those over 60 who, from the time of reaching 60 years of age,
are to continue working with a pay cut of more than 25%,
with the equivalent of 15% of their pay until they reach 65 years of age,
with the aim of promoting the maintenance of employment and reemployment
among people aged between 60 and 65.
|
| |
4.
|
The applicable age group for the healthcare system for
the elderly was in October 2002 raised by five years from the over-70s to the
over 75s; thus it is necessary to bear in mind that the above figures for elderly
healthcare (medical areas) benefits in 2002 and 2003 differ in terms of their
applicable age range. That the rate of increase compared with the previous year
is a minus figure is a reflection of this. According to the “2003 National Medical
Care Expenditure (Ministry of Health,
Labor and Welfare),” the national medical expenses for the over-75s in 2003 rose
by 3.8% compared with the previous year.
|
Return to the Contents
Return to the top page of The Cost of Social Security in Japan

|