|
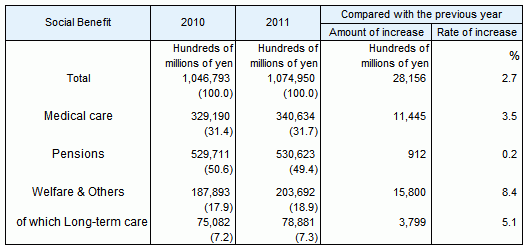
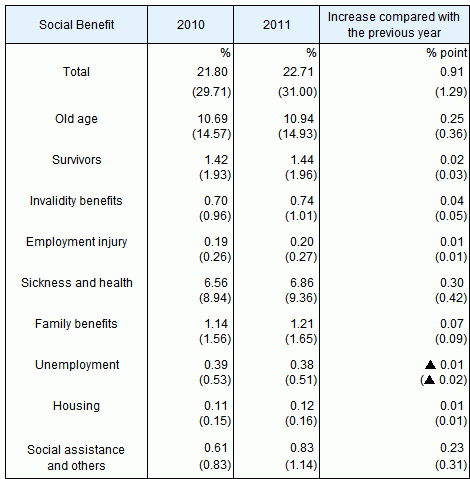
Table 7. Social Benefit by category
|
Note:
|
1.
|
( ) The ratio to the total is expressed as a percentage.
|
|
|
2.
|
|
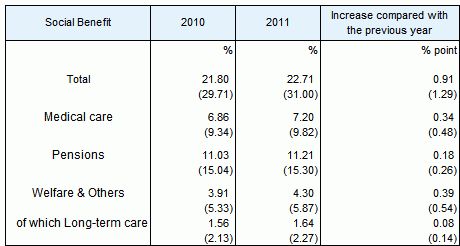
Table 8. Social Benefit by category as a percentage of GDP (NI)
|
Note:
|
|
Figures within brackets, ( ), represent the percentages of National Income (NI).
|
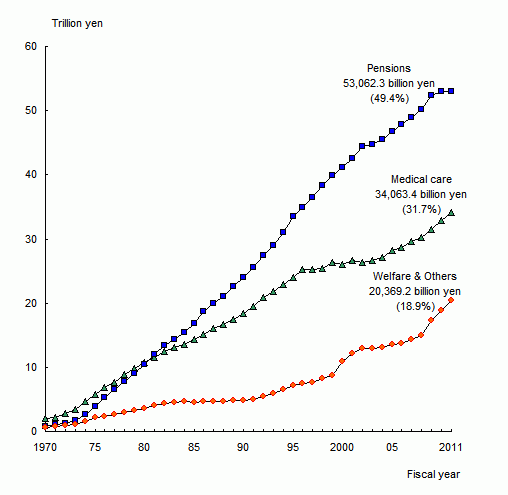
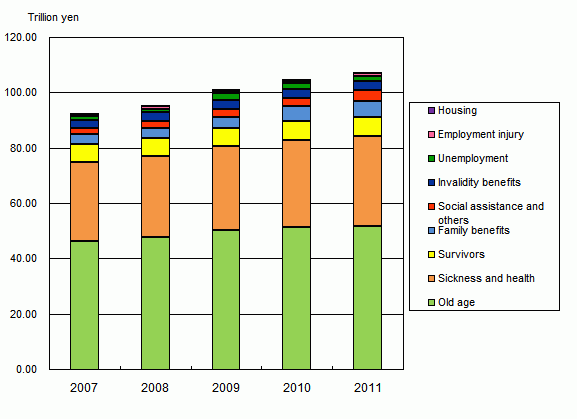
Figure 4. Social Benefit by category, fiscal year 1970-2011
|
(2)
|
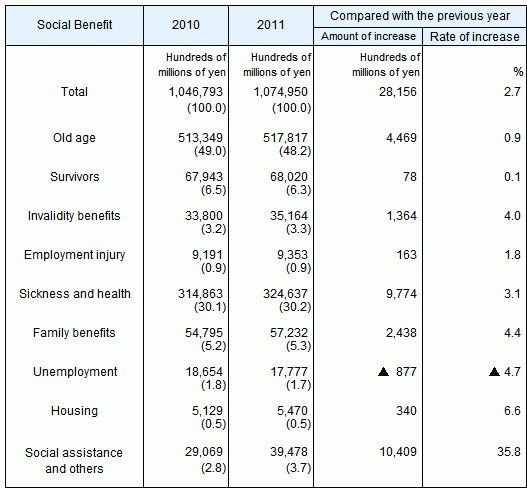
Social Benefit by functional category
Among the nine functional categories of Social Benefit in the fiscal year 2011, "Old age" was the largest component representing 48.2% of the total amount, and "Sickness and health" was the second largest represnting 30.2% of the total; hence, these two functional categories account for 78.4% of the total. The expenditure in these two categories was followed by "Survivors" (6.3%), "Family benefits"(5.3%), "Social assistance and others"(3.7%), "Invalidity benefits"(3.3%), "Unemployment"(1.7%), "Employment injury"(0.9%), and "Housing"(0.5%).
|
Table 9. Social Benefit by functional category
|
Notes:
|
1.
|
( ) The ratio to the total is expressed as a percentage.
|
|
|
2.
|
Refer to Appendix 3 for more details about functional classifications. |
Table 10. Social Benefit by functional category as a percentage of GDP (NI)
|
Note:
|
|
Figures within brackets, ( ), represent the percentages of the National Income (NI).
|
Figure 5. Social Benefit by functional category, fiscal years 2007-2011
|
(3)
|
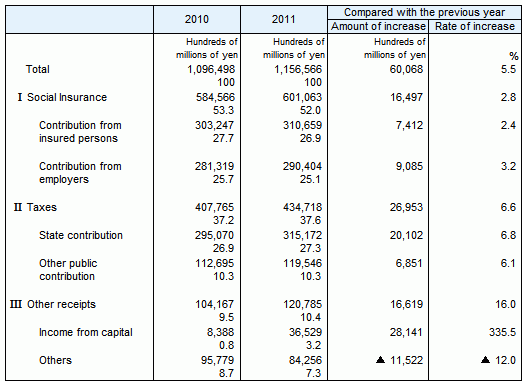
Social Security Revenue
Social Security Revenue in the fiscal year 2011 amounted to 115,656.6 billion yen, which was an 5.5% increase from the amount in the previous fiscal year. Among different sources of Social Security Revenue, Social Insurance accounts for 52.0%, Tax for 37.6%, and Other Receipts for 10.4% of the total.
|
Table 11. Social Security Revenue by source
| Notes: |
1. |
( ) The ratio to the total is expressed as a percentage. |
|
2. |
Taxes are the sum of "State contribution" and "Other public contribution." Here, "Other public contribution" refers to the contribution from local governments. However, the contribution from local governments is the expenditure that local governments are responsible for based on the National System, and this does not include expenditure for projects indipendently run by each local government. |
|
3. |
It should be noted that "Income from capital" fluctuates depnding on the performance of the public pension scheme, etc. Also, "Others" include acceptance from the reserve funds. |
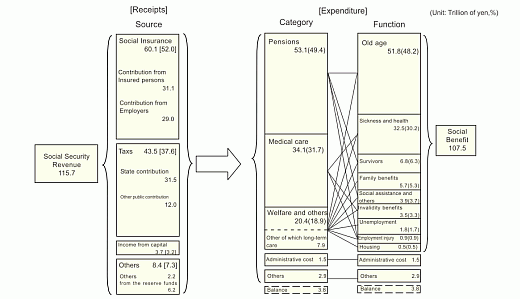
Figure 6. Diagram of Social Security Revenue and Social Benefit based on the ILO Standards, fiscal year 2011
|
Notes:
|
1.
|
Fiscal year 2011 Social Security Revenue amounted to 115.7 trillion yen (excluding transfer from other systems). The figure in square brackets [ ] represents the ratio of the Social Security Revenue total.
|
|
|
2.
|
Fiscal year 2011 Social Security Revenue amounted to 107.5 trillion yen. The figure in parentheses ( ) represents the ratio of the Social Benefit total.
|
|
|
3.
|
Others in the receipt includes receipts from the reserve funds, etc. Others in the expenditure includes maintenance expenses for the facilities, etc.
|
|
|
4.
|
Balance refers to the difference between Social Security Revenue (115.7 trillion yen) and the sum of Social Benefit, administrative costs, operating losess, and others (111.9 trillion yen), and does not include any transfer to and from other systems; in particular, balance represents transfers to the reserve fund and the balance carried forward to the following fiscal year.
|
|