III. Time Series Table
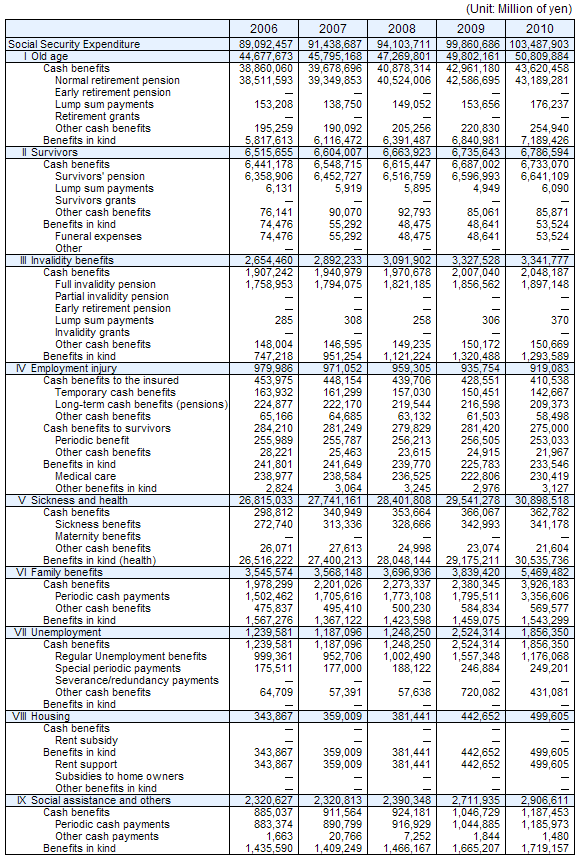
Table 13. Social Benefit by functional category, fiscal years 2006-2010 Note: 1. Figures in Table 13 has been calculated in accordance with the standards of the ILOs The Cost of Social Security 19th International Inquiry. 2. Refer to Appendix 3 for an explanation of the categories in the functional classification. Download the following >> "Social Benefit by functional category, fiscal years 2006-2010" as Excel data. Return to the Contents Return to the top page of the Financial Statistics of Social Security in Japan
Return to the Contents
Return to the top page of the Financial Statistics of Social Security in Japan