I. Summary of Social Expenditure and Social Benefit, FY 2010


2.
Social Expenditure and its international comparison

(1) Social Expenditure by policy area
Among the nine policy areas of Social Expenditure in the fiscal year 2010, "Old age" was the largest component (47.3%), followed by "Health" (31.7%), "Survivors" (6.3%), "Family" (5.5%), "Incapacity- related benefits" (4.8%), "Unemployment" (1.3%), "Active labour market programmes" (1.2%), "Other social policy areas" (1.1%), and "Housing" (0.7%).


Table 4. Social Expenditure by policy area
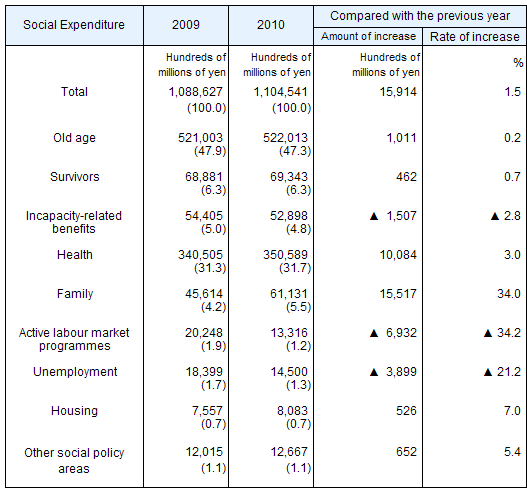
 Social Expenditure by policy area
Note: Figured within brackets, ( ), represent the percentage of total expenditure.

Table 5. Social Expenditure by policy area as a percentage of GDP
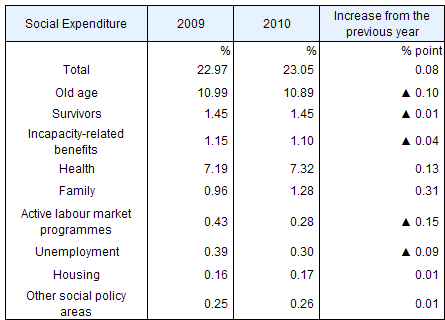
Social Expenditure by policy area as a percentage of the GDP

Figure 1. Trends in Social Expenditure by policy area in Japan
Trends in Social Expenditure by policy area in Japan


(2) International Comparison of Social Expenditure
The international comparison of the scale of Social Expenditure measured as a percentage of the Gross Domestic Product (GDP) and as a percentage of the National Income (NI) shows that the scale in Japan is larger than that in the U.S.A. but smaller than that in European nations.

Figure 2. International Comparison of Social Expenditure, fiscal year 2009
International Comparison of Social Expenditure, fiscal year 2009


Table 6. International Comparison of Social Expenditure, fiscal year 2009
International Comparison of Social Expenditure, fiscal year 2009
Source: OECD Social Expenditure Database 2012 ed.
(http://www.oecd.org/els/social/expenditure)
GDP and National Income data on Japan are based on the "Annual Report on the National Accounts Statistics 2012" (Cabinet Office, Government of Japan), while the data on other countries are based on the OECD National Accounts 2012 (hereafter the same).


Figure 3. International Comparison of Social Expenditure by policy area in FY 2009
International Comparison of Social Expenditure by policy area in FY 2009

Table 7. International Comparison of Social Expenditure per GDP in FY 2009
International Comparison of Social Expenditure per GDP in FY 2009


Return to the Contents

Return to the top page of the Financial Statistics of Social Security in Japan

Go back to the IPSS top page