II. Summary of 1997 statistics

1. Social security expenditure in fiscal year 1997 was 69,418.7 billion yen.

(i)
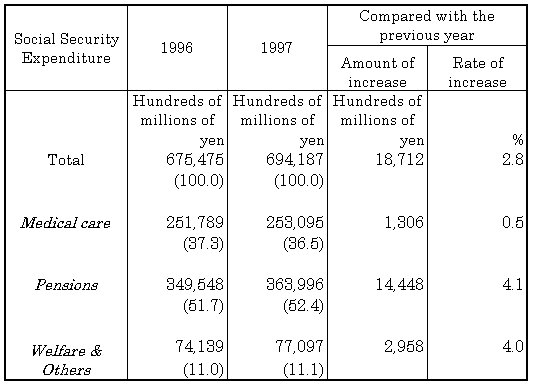
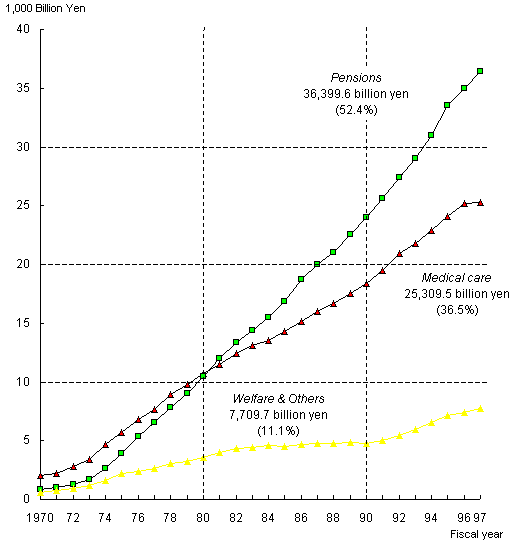
Of the three categories, Medical care was estimated at 25,309.5 billion yen and its share of the total was 36.5 percent. Pensions was 36,399.6 billion yen and its share of the total was 52.4 percent. Welfare & Others was 7,709.7 billion yen and its share was 11.1 percent.
(ii)
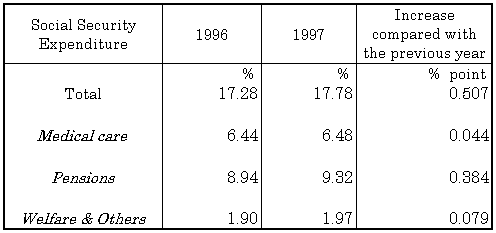
Social security expenditure increased by 2.8 percent in fiscal year 1997. The percentage share of the National Income was 17.78 percent.
(iii)
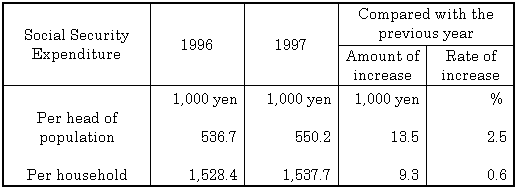
Social security expenditure per head of population was estimated at 550,200 yen, and the average expenditure per household was 1,537,700 yen.

Table 1 Social Security Expenditure by category, fiscal years 1996 and 1997

Table 1 Social Security Expenditure by category
Note: ( ) Ratio to the total as a percentage.

Table 2 Social Security Expenditure by category as percentage of National Income

Table 2 Social Security Expenditure by category as percentage of National Income

Table 3 Social Security Expenditure per head of population and per household, fiscal years 1996 and 1997

Table 3 Social Security Expenditure per head of Population and per household
Note:
Social security expenditure per household = (Number of people in the household/Total number of households)~social security expenditure per head of population.

Figure 1 Social Security Expenditure by category, fiscal years 1970-1997

Figure 1 Social Security Expenditure by category, fiscal years 1970-1996

2.

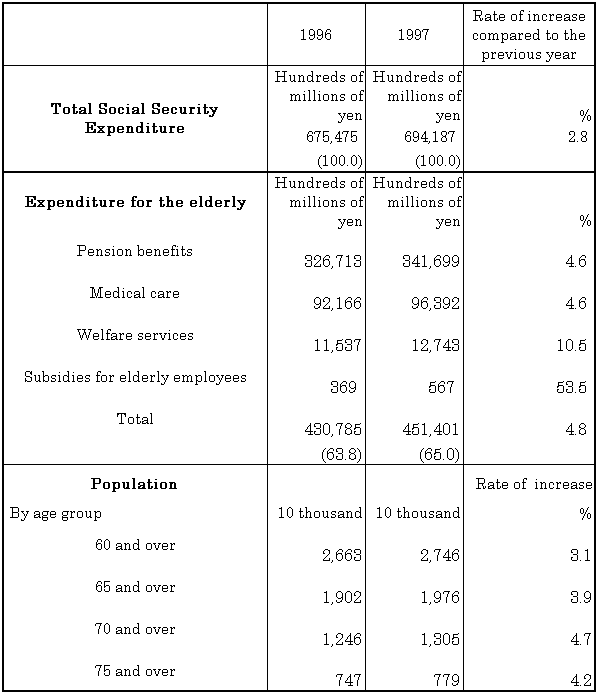
Social security expenditure for the elderly (i.e., retirement pensions, medical care for the aged, welfare services for the aged) was 45,140.1 billion yen. Its share of social security expenditure was 65.0 percent.

Table 4 Social Security Expenditure for the elderly, fiscal years 1996 and 1997

 Table 4 Social Security Expenditure for the aged, fiscal years 1995 and 1996

Notes:
1.
Ratio to the total social security expenditure as a percentage.
2.
Medical care: Total expenditures of Health and Medical Services for the Aged excluding public health measures (e.g., medical check-ups and counseling, etc.).
3.


Subsidies for elderly employees are grants in which, from the viewpoint of promoting continued employment and re-employment for 60 to 65-year-olds, 25 percent of the wages earned by people over 60 years old is provided to elderly people continuing to work whose wage has dropped considerably since turning 60. This grant is provided to elderly people under the age of 65.

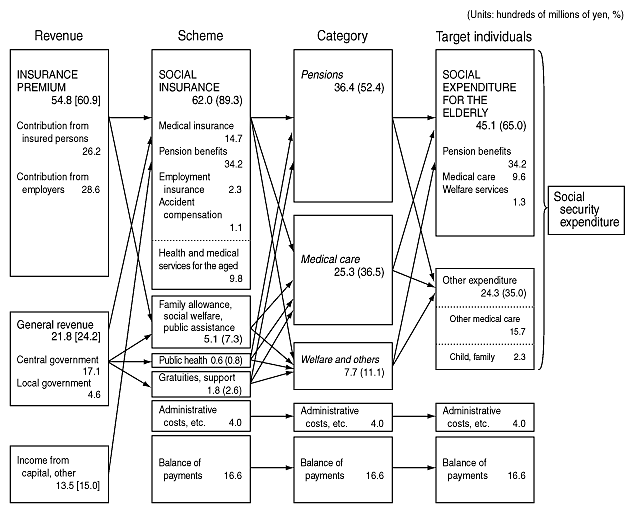
Figure 2 Social Security Expenditure by revenue, scheme, category and target individuals, fiscal year 1997

 Figure 2 Social Security Expenditure by income, structure, sector and target individuals, fiscal year 1997
Notes:
1.
gChild, familyh refers to medical insurance in the form of a lump sum maternity allowance and child-rearing allowance, employment insurance in the form of parent leave allowance, day-care facilities administration costs and single parent family and disabled child allowance.
2.
FY1997 social security revenues amounted to 90.1 trillion yen (excluding transfer from other systems). The figure in square brackets represents the ratio of social security revenues total.
3.
FY1997 social security expenditure amounted to 69.4 trillion yen. The figure in parentheses represents the ratio of social security expenditure total.
4.
Arrows have been omitted from gRevenueh to gAdministrative costs,h and gBalance of paymentsh in gSchemeh.
5.
Other expenditure for target individuals refers to expenditure except for Social Expenditure for the Elderly.

go to Top Page

Return to the Contents