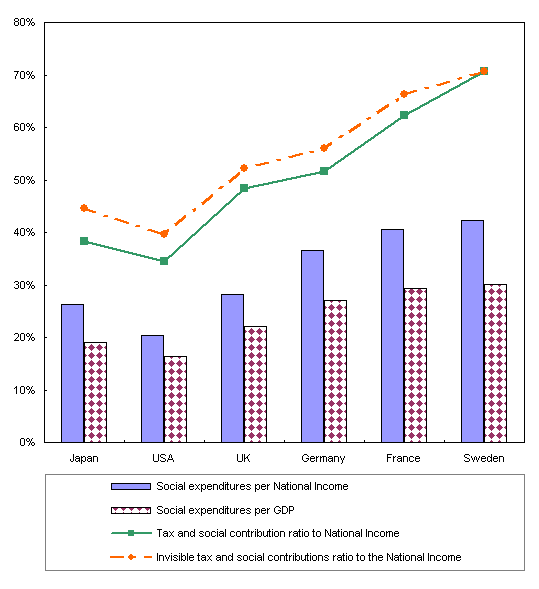
When the Social Security Expenditure of various countries is compared against their Gross Domestic Product (GDP), that of Japan is higher than the United States but lower than Europe. We see a similar trend in terms of the burden, as well as invisible burden of tax and social contribution to the National Income in Japan. (Reference Figure 1)
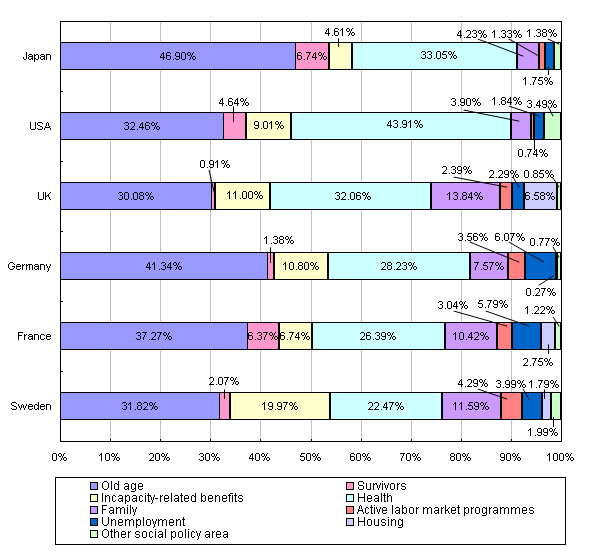
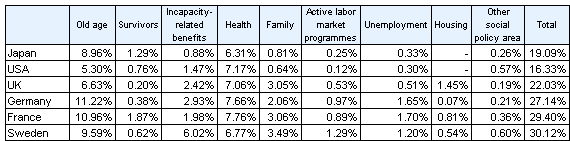
In addition, looking at the structural makeup of the Social Expenditure, the share of areas such as family, active labor market policies and unemployment expenses is low in Japan compared with that in European countries (Reference Figure 2)
Reference Figure 1 International comparison of social expenditures and visible and invisible tax and social contributions ratio to the National Income in FY 2005
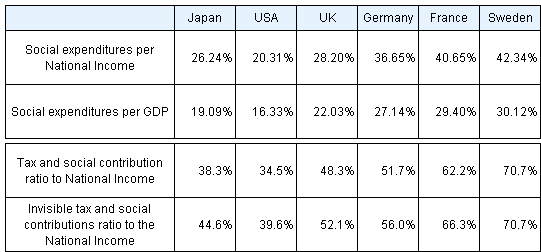
Reference Table 2 International comparison of social expenditures and visible and invisible tax and social contributions ratio to the National Income in FY 2005
| Note: |
Taxes include social security costs as well as other expenses. |
| Source: |
OECD Social Expenditure Database 2008 ed.
The national income and GDP of Japan are from the “System of National Accounts 2008” Cabinet Economic and Social Research Institute (as are all listed below).
The (invisible) tax and social contributions to national income are presented by the Ministry of Finance, Japanese Government. |
Reference Figure 2 International Comparison of Social Expenditure by Policy Area in FY 2005
Reference Table 3-1 International Comparison of Social
Expenditure per National Income in FY 2005
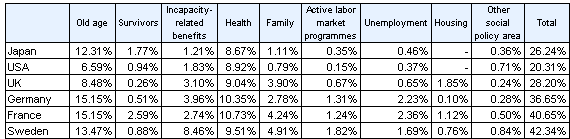
Reference Table 3-2 International Comparison of Social
Expenditure per GDP in FY 2005
|
Note:
|
The OECD Social Expenditure Database has no estimates of revenue data.
|
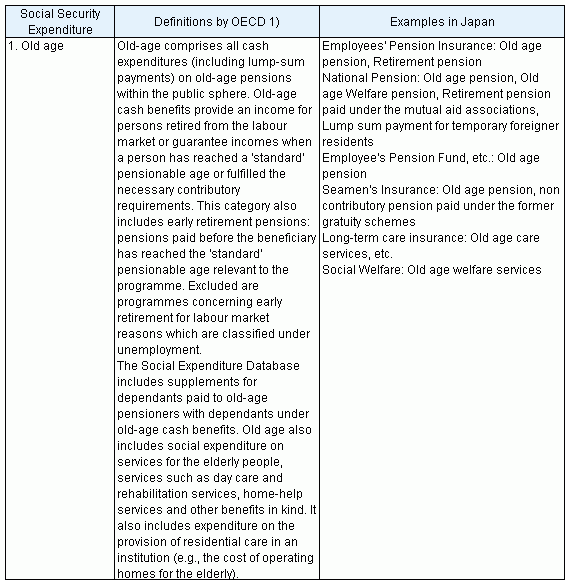
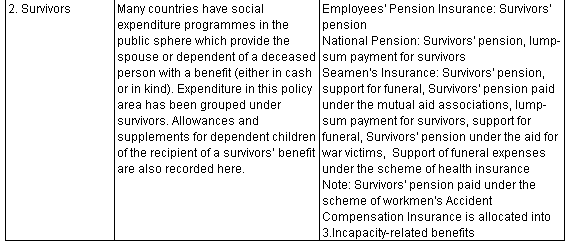
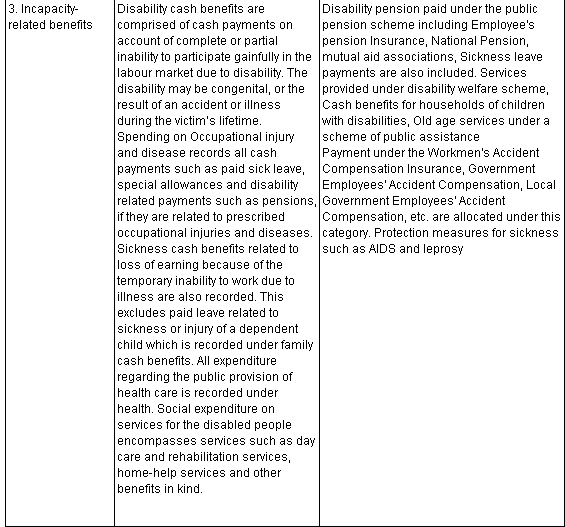
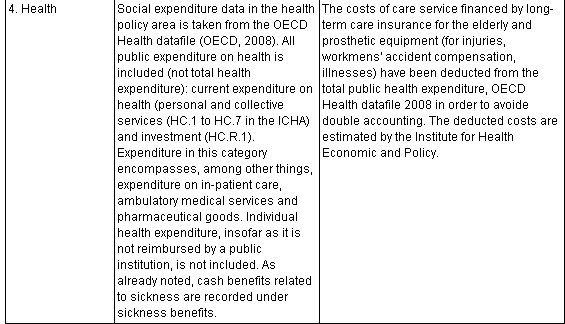
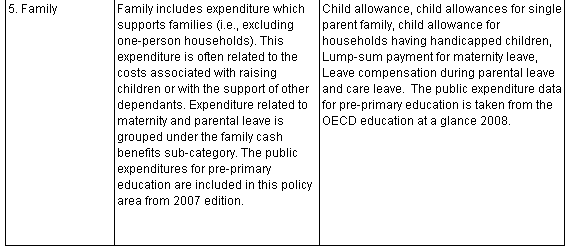
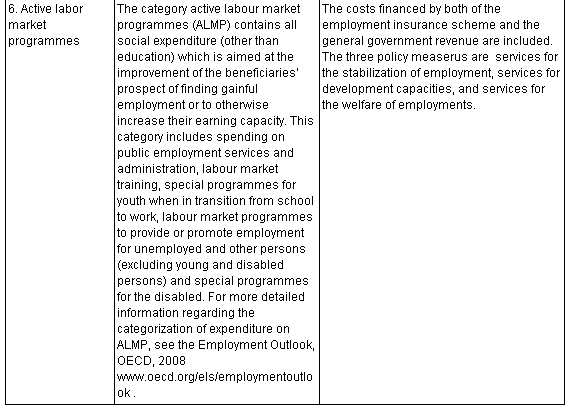
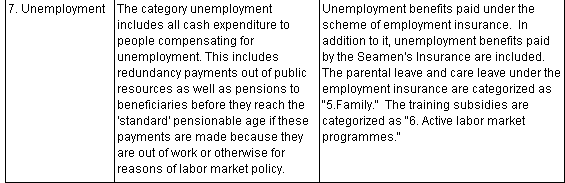
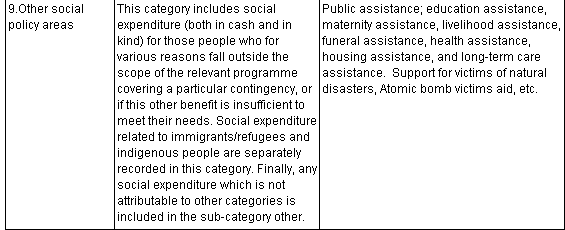
Reference Chart 4 Definitions of OECD of Social Expenditure by policy area
|
Notes:
|
1.
|
OECD Definitions are followed by the OECD Social Expenditure.
|
|
|
2.
|
The Japanese translation of "9. Other social policy areas" are "Social Assistance and others" with a reference to the included major schemes.
|
Return to the Contents
Return to the top page of The Cost of Social Security in Japan