|
 |
 |
 |
| ( i ) |
|
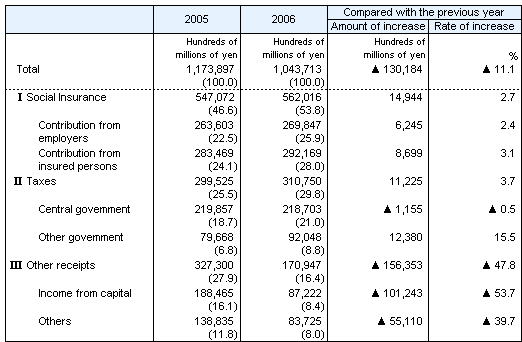
Percentages in each category indicate that Social Insurance is 53.8%, Tax is 29.8%, and Other Receipts is 16.4% of the total.
|
| ( ii ) |
|
Revenue has decreased 11.1% as compared to the previous fiscal year.
|
Table 7 Social Security Revenue by source,
fiscal years 2005 and 2006

| Notes: |
1. |
( ) The ratio to the total is expressed as a percentage. |
|
2. |
“Other receipts,” where “Income from capital” included, the capital gain from the employees’ pension funds and others are evaluated as current price of value. “Others” includes “Transfers from reserves.”
|
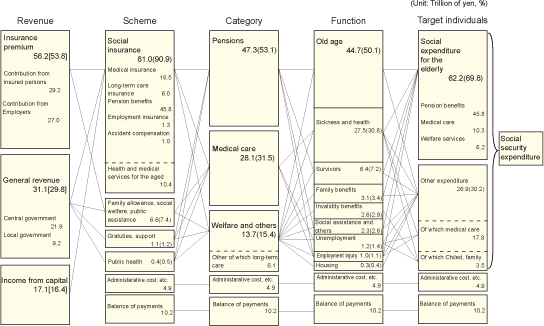
Figure 3 Social Security Expenditure
by revenue, scheme, category, function and target individuals,
fiscal year 2006

|
Notes:
|
1.
|
“Child, family” refers to
medical insurance in the form of a lump sum maternity
allowance and child-rearing allowance, employment insurance
in the form of parental leave allowance, day-care facilities
administration costs and single parent family and disabled
child allowance.
|
|
|
2.
|
Fiscal year 2006 Social Security Revenue
amounted to 104.4 trillion yen (excluding transfer from
other systems). The figure in square brackets [ ] represents
the ratio of the Social Security Revenue total.
|
|
|
3.
|
Fiscal year 2006 Social Security Expenditure
amounted to 89.1 trillion yen. The figure in parentheses
( ) represents the ratio of the Social Security Expenditure
total.
|
|