The Social Expenditures were previously put together according to International Labor Organization (ILO) standards, and were an important indicator of changes from the past situation; however, data for this standard from the various countries has not been updated since 1996, and there are no indications that it will be updated in the future.
On the other hand, although its scope is somewhat different, the Social Security Expenditure for the OECD standard makes public relatively up-to-date annual data from the various countries, and therefore this report has since last year contained the OECD’s estimations.
The scope of the OECD standard of Social Expenditure is broader than that of the ILO, and it includes the figures for expenditure not directly spent on individuals, such as expenditure on equipping facilities.
This year, as a result of an investigation into the details of the estimation method of the OECD standard of Social Expenditure, Japan’s data was scrutinized, and this research institute conducted an estimation that went right back into the past. With regard to the details of the estimation method, please refer to the “Point-by-point explanation of the policy areas of Social Expenditure.” In addition, the data for countries other than Japan, which forms an international point of comparison, is from OECD estimations.
Japan’s Social Expenditure by OECD standards
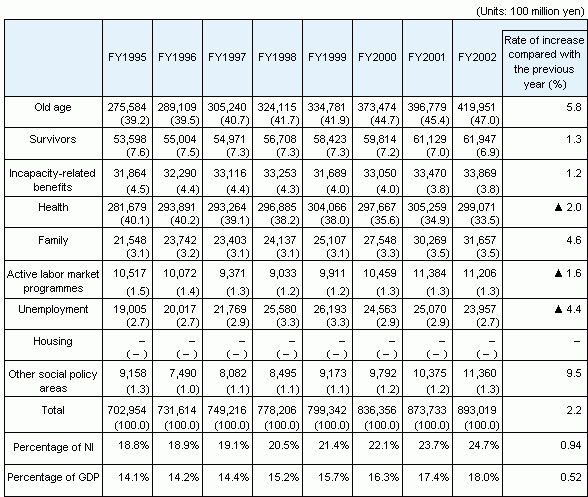
According to the OECD standards, Japan’s Social Expenditure in 2002 was 89.3 trillion yen. Looking at the different policy areas, expenditure on “Old age” was the greatest at 42.0 trillion yen (47%), followed by, in order, “Health” at 29.9 trillion yen (33.5%) and “Survivors” at 6.2 trillion yen (6.9%).
Social Expenditure grew by 2.2% in comparison with the previous year, to 18.0% of GDP.
Reference Table 1 Trends in Japanese social
expenditure

|
NB:
|
1.
|
Figures within brackets, ( ), represent the percentage of total expenditure.
|
|
|
2.
|
The column showing “Rate of increase compared with the previous year” for percentage of national income and GDP, shows the rate at which these areas have increased in comparison with the previous year (Unit: percentage points).
|
|
Source:
|
|
National Institute of Population and Social Security Research estimates
|
Return to the Contents
Return to the top page of The Cost of Social Security in Japan
