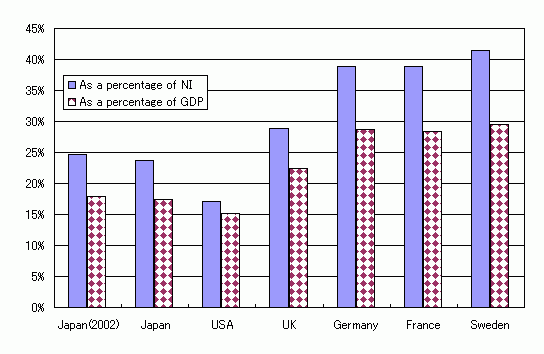
When the Social Security Expenditure of various countries is compared against their Gross Domestic Product (GDP), that of Japan is higher than the United States but lower than Europe (Reference Figure 1)
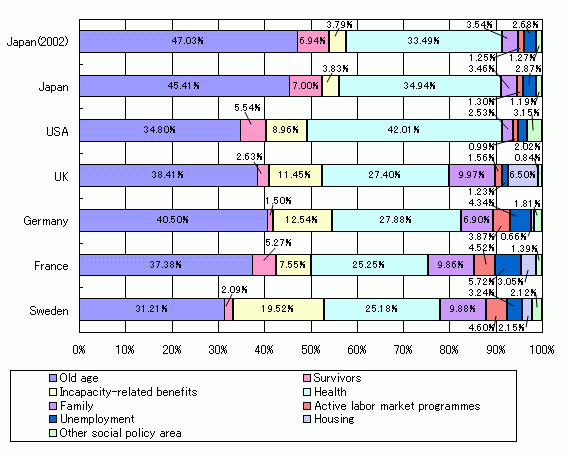
In addition, looking at the structural makeup of the Social Expenditure, the share of areas such as family, active labor market policies and unemployment expenses is low in Japan compared with that in European countries (Reference Figure 2)
Reference Figure 1 International Comparison
of Social Expenditure relative to National Income and Gross Domestic Product
in 2001

Reference Table 2 International Comparison
of Social Expenditure relative to National Income and Gross Domestic Product
in 2001

Source: Regarding the Social Expenditure in 2001 of counties outside Japan OECD Social Expenditure Database 2004.
In the case of Japan, this is calculated by the National
Institute of Population and Social Security Research according to the OECD
Social Expenditure definition (refer to chart 1)
The national income and GDP of Japan are from the “System of National Accounts
2005” Cabinet Economic and Social Research Institute (as are all listed below)
Reference Figure 2 International Comparison of Social
Expenditure by Policy Area in 2001

Reference Table 3-1 International Comparison of Social
Expenditure relative to National Income in 2001

Reference Table 3-2 International Comparison of Social
Expenditure relative to GDP in 2001

|
Note:
|
The OECD Social Expenditure Database has no estimates of revenue data.
|
Reference Chart 4 Point-by-point breakdown of Social Expenditure by policy area
|
NB:
|
1.
|
OECD is defined as the OECD Social Expenditure database 2004ed standard.
|
|
|
2.
|
The last policy area of the English version of the OECD is “Other Social Policy Fields,” but in the Japanese translation, this was represented by “Social assistance” as being more representative.
|
| |
3.
|
The values for areas other than “Healthcare,” “Active labor market policies” and “Unemployment” are based upon OECD estimations using data previously gathered by this research institute, and are thus in line with this.
|
Return to the Contents
Return to the top page of The Cost of Social Security in Japan
