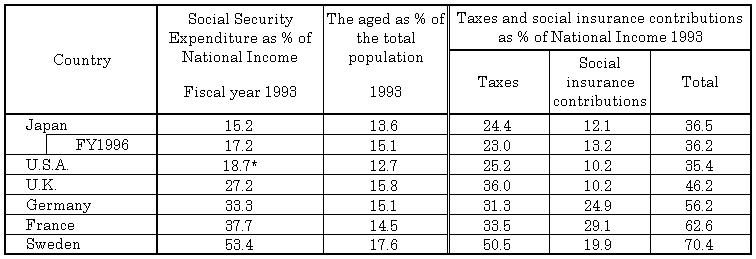
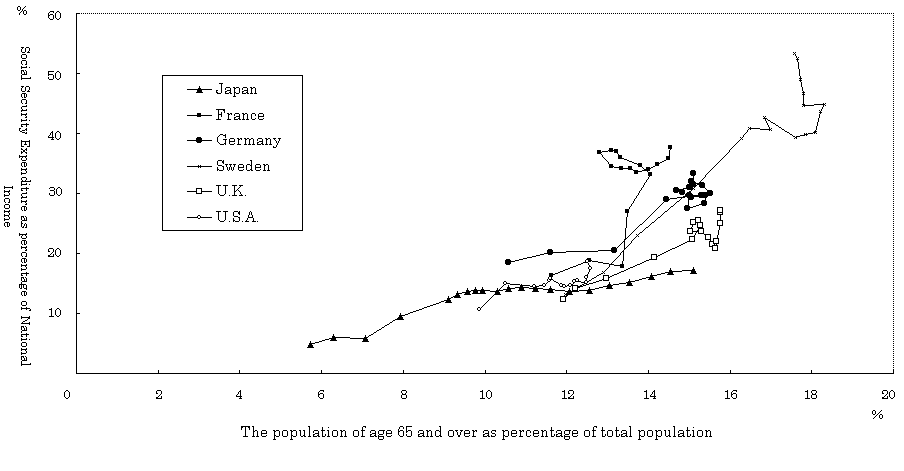
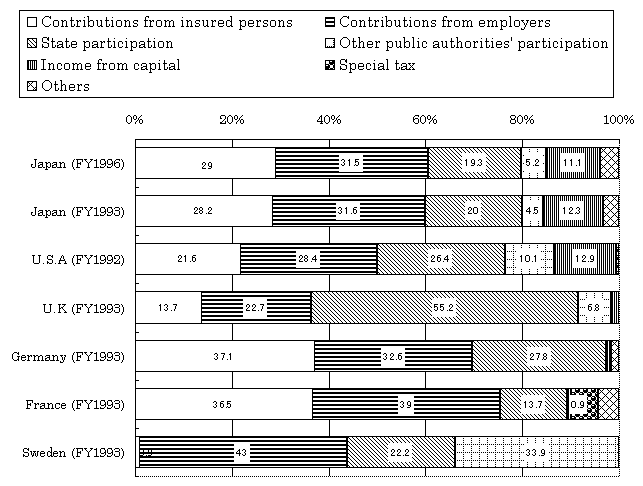
| Table 5International comparison of social security expenditure, taxes, and social insurance contributions |
 |
| Notes: |
| 1.Social security expenditure is derived from ILO standards. |
| 2.There was no data available for social security expenditure for the U.S.A., the figure for FY1992 was used as reference.(*) |
3.The figures for Japan in regards to taxes and social insurance contributions as a percentage of National Income are calculated on a fiscal year basis (1 April to 31 March) while other countries' figures are calculated on a calendar year basis.
|
|
| Sources: |
| National Income data for foreign countries are taken from "National Accounts," OECD (Paris 1998) |
| The aged as a percentage of the total population for other countries is taken from the "Demographic Yearbook," and "The Sex and Age Distribution of World Population," published by the United Nations.
|
|
| Taxes & social insurance contributions as a percentage of National Income data is taken from the 1998 Discussion of the Budget published by the Fiscal Research Committee. |
,
| Table 6International Comparison of Social Security Expenditure |
 |
Reference: Calculations for each fiscal year for each country are based on the average of each country's yearly exchange market, such that the U.S.A. figure is 442,461 yen, the U.K. figure is 378,326 yen, the German figure is 667,246 yen, the French figure is 674,140 yen and the Swedish figure is 910,585 yen.
|
| Note:
The above figures for each country are based on the ILO's Social Security Survey, and the National Institute of Population and Social Security Research has taken the estimates made by each country; therefore there may be discrepancies with the published figures by the ILO. |


