As in the previous projections, the cohort component method is used for the Population Projections for Japan. This is a method for projecting future population of each age- and sex-specific group according to assumptions about three components of population change-fertility, mortality, and migration.
Projecting the population using the cohort component method requires the following assumptions to be set for each sex and age group:
(1) jump-off population
(2) future fertility rate (and the sex ratio at birth)
(3) future survival rate
(4) future international migration rates (numbers)
In these projections, as in the past, we set these assumptions based on
past trends for each component using the demographic method. Given that
future changes in fertility and mortality cannot be known with certainty,
we set multiple assumptions and produced multiple possible projections
based on the assumptions, to provide a well-defined range of population
projections.
1. Jump-off Population
For the jump-off population, which serves as the starting point of the projections, we used data on the total population by age and sex as of October 1, 2010, taken from the 2010 Population Census of Japan, compiled by the Statistics Bureau of the Ministry of Internal Affairs and Communications. This value was calculated by the Statistics Bureau of the Ministry of Internal Affairs and Communications as the jump-off population (as of October 1, 2010) in the 2010 Population Census by evenly distributing the population of “not reported” nationality and age included in the 2010 Population Census (results of basic complete tabulation on population and households) in order to project future population based on the population obtained in the Population Census.
2. Assumptions for Fertility Rates and Sex Ratio at Birth
Projecting the future number of births in the projections requires data of the female age-specific fertility rate of the year in question. In the present projections, we used cohort fertility data to estimate the future fertility rate. In this method, we observe the birth process per female birth cohort (a population group born in the same year) over the course of their lives, and forecasts the fertility rate for cohorts whose birth process is incomplete, for each year until the process is complete. The future age-specific fertility rates and total fertility rates on an annual basis can be obtained by converting the cohort age-specific data into annual data. Note that we analyzed the past records of births from Japanese women only, based on which we projected the fertility trend for the whole population base, with the aim of obtaining further precision in the determination of fertility rate trends. Therefore, the assumed index figures in relation to marriage and childbirth described hereafter all refer to Japanese women (the approach to handling the fertility rate of non-Japanese women is explained later.)
Cohort age-specific fertility rates were statistically estimated and/or assumptions were set by each order of birth by way of models that use the lifetime probability of birth, age of childbearing, and so on. That is, in the case of cohorts that are currently going through the birth process, the lifetime birth process is statistically estimated from the actual figures derived during the birth process. For young cohorts for whom only scant or no actual birth data is available yet, however, the index at the completion of birth process was calculated based on indexes projected separately for the reference cohort. Note that the reference cohort refers to women born in 1995. We projected individual index values for first marriage behavior, couples’ reproductive behavior, and behavior pertaining to divorce, bereavement, and remarriage based on actual statistics, and set the total cohort fertility rate and the distribution by birth order based on the calculation results for those index values.
Because the future development of fertility is uncertain, we decided to set the aforementioned three assumptions (medium, high, and low-variant projections) and project future population based on each assumption. This approach allows accounting for a certain range of fluctuation that can be expected in the future population trends, brought about by changes in birth view from the current state.
(1) Medium-fertility Assumption
(i) The mean age at first marriage of women by cohort increases gradually from 25.7 years of age for the cohort born in 1960 to 28.2 years of age for the cohort born in 1995. It levels off at nearly the same level until the cohort born in 2010 and remains unchanged thereafter.
(ii) The proportion of never married women increases from 9.4% for the cohort born in 1960 to 20.1% for the cohort born in 1995. It then levels off at nearly the same level until the cohort born in 2010 and remains unchanged thereafter.
(iii) Delayed marriage, delayed childbearing, and changes in the reproductive behavior of couples affect the completed number of births from married couples. Using couples with wives in the cohorts born from 1935 to 1954 as a benchmark (1.0), the index indicating changes in the reproductive behavior of couples (fertility variation coefficient of married couples) declines to 0.920 children for the cohort born in 1995. It remains at nearly the same level until the cohort born in 2010 and remains unchanged thereafter. The completed number of births from married couples is obtained from this index and the change in first marriage behavior outlined in assumptions (i) and (ii) above, and drops from 2.07 for the cohorts born from 1958 to 1962 to 1.74 for the cohort born in 1995, remaining unchanged thereafter.
(iv) We obtained the effects of divorce, bereavement, and remarriage on fertility rates (the coefficient of divorce, bereavement, and remarriage) based on the completed number of births from women with these experiences and the trend of structural changes in marital status. As a result, by setting the fertility level of first-marriage couples who have completed the birth process as a benchmark (1.0), the coefficient of divorce, bereavement, and remarriage decreases from the actual figure of 0.962 for the cohort born in 1960 to 0.938 for the cohort born in 1995. It remains unchanged thereafter.
As a result of the assumptions (i) to (iv) above, the total cohort fertility rate of Japanese women decreases from the actually observed figure of 1.808 for the cohort born in 1960 to 1.301 for the cohort born in 1995. It remains almost constant until the cohort born in 2010, and remains unchanged thereafter.
We converted the cohort age-specific fertility rates obtained above into an annual fertility rate. Subsequently, we assumed that the relationship between moments of the fertility rate of non-Japanese women obtained from the actual statistics and that of Japanese women to be constant and obtained the age-specific fertility rate of non-Japanese women on that basis. With this operation, it becomes possible to calculate the fertility rate with the same definition as the Vital Statistics when making the projections (i.e., the fertility rate including children of Japanese nationality born from women of non-Japanese nationality; see the formula below).
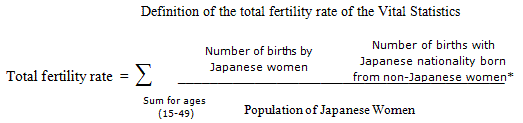
* A child with Japanese nationality born from a non-Japanese female is a child whose father is Japanese.
Note that due to the impacts of the Great East Japan Earthquake that occurred in March 2011, the number of births from December 2011 is anticipated to fluctuate for a short period of time. We thus referred to the actual fluctuation in the number of births in 1995 when the Great Hanshin-Awaji Earthquake occurred, the number of recent Pregnancy Notifications and other relevant statistics to separately calculate the number of births in 2011 and 2012, which were set as assumption figures.
The results of the calculations above show that the total fertility rate of the same definition as the Vital Statistics, whose statistic value was 1.39 in 2010, will largely remain at 1.39 until 2014, except for a brief drop to 1.37 in 2012. It is then expected to gradually drop until it reaches 1.33 in 2024, whereupon it will increase slightly to 1.34 in 2030 and 1.35 in 2060 (see Table 4-1 and Figure 4-1).
(2) High-fertility Assumption
(i) The mean age at first marriage of women by cohort will advance to 27.9 years of age for the cohort born in 1995, maintain almost the same level up to the cohort born in 2010, and remain unchanged thereafter.
(ii) The proportion of never married women increases to 14.7% for the cohort born in 1995, ultimately dropping to 14.3% for the cohort born in 2010 and remaining unchanged thereafter.
(iii) Using couples with wives in the cohorts born from 1935 to 1954 as a benchmark (1.0), the fertility variation coefficient of married couples, which indicates changes in the reproductive behavior of couples, declines temporarily but returns to 1.0 before the cohort born in 1995. The completed number of births from married couples derived from this coefficient and changes in first marriage behavior explained above will reach 1.92 children for the cohort born in 2010, up from 1.91 for the cohort born in 1995, and it will remain unchanged thereafter.
(iv) The coefficient of divorce, bereavement, and remarriage will decrease from the actual figure of 0.962 for the cohort born in 1960 to 0.937 for the cohort born in 1995, remaining unchanged thereafter.
From the assumptions (i) to (iv) above, the total cohort fertility rate of Japanese women is projected to decrease from the actual figure of 1.808 for the cohort born in 1960 to 1.531 for the cohort born in 1995, eventually reaching 1.541 for the cohort born in 2010 and remaining unchanged thereafter.
We made similar operations for the impacts of the Great East Japan Earthquake
as for the medium-fertility assumption, and the total fertility rate with
the same definition as the Vital Statistics will under the above assumptions
increase from the actual figure of 1.39 as of 2010 to 1.44 in 2011 and
to 1.61 in 2020, eventually dropping to 1.60 in 2060 (see Table 4-1 and Figure 4-1).
(3) Low fertility Assumption
(i) The mean age at first marriage of women by cohort will increase to 28.5 years of age for the cohort born in 1995 and to 28.6 years of age for the cohort born in 2010, and remain unchanged thereafter.
(ii) The proportion of never married women increases to 26.2% for the cohort born in 1995, and eventually reaches 26.6% for the cohort born in 2010, remaining unchanged thereafter.
(iii) Using couples with wives in the cohorts born from 1935 to 1954 as a benchmark (1.0), the fertility variation coefficient of married couples, which indicates changes in the reproductive behavior of couples, declines steadily to 0.842 for the cohort born in 1995, eventually reaching 0.845 for the cohort born in 2010 and remaining unchanged thereafter. The completed number of births from married couples derived from this coefficient and the changes in first marriage behavior above will decrease to 1.57 children for the cohort born in 1995, and remain unchanged until the cohort born in 2010 and thereafter.
(iv) The coefficient of divorce, bereavement, and remarriage will decrease
from the actual figure of 0.962 for the cohort born in 1960 to 0.938 for
the cohort born in 1995, remaining unchanged thereafter.
Based on assumptions (i) to (iv) above, the total cohort fertility rate of Japanese women will decrease from the actual figure of 1.808 for the cohort born in 1960 to 1.087 for the cohort born in 1995, eventually reaching 1.079 for the cohort born in 2010 and remaining unchanged thereafter.
We made similar operations for the impacts of the Great East Japan Earthquake as for the medium-fertility assumption, and the total fertility rate with the same definition as the Vital Statistics will under the above assumptions decrease from the actual figure of 1.39 as of 2010 to 1.31 in 2011, eventually dropping to 1.08 in 2023, whereafter it will exhibit a slight increase to 1.12 in 2060 (see Table 4-1 and Figure 4-1).
Regarding the sex ratio at birth (the number of male children for every 100 female children) that is used to divide the future number of newborns into male and female births, we assumed the actual figure for the five years from 2006 to 2010 (105.5) to remain constant for 2011 and thereafter.
3. Assumptions for Survival Rates (Future Life Table)
In order to project the population from one year to the next, survival rates by age and sex are needed, and, in order to obtain future survival rates, it is necessary to construct future life tables. In the Projections, we have adopted the Lee-Carter model, which is currently internationally recognized as the standard model, to construct future life tables, and we modified the model by adding new features so that the model adapts properly to the Japan’s characteristic mortality trend, which exhibits the highest level of life expectancy in the world. The Lee-Carter model describes the change in mortality rates for each age according to the change in general mortality level, by decomposing the matrix of age-specific mortality rates into a standard age schedule, a general level of mortality (mortality index), age-specific mortality rate changes relative to the mortality index, and an error term. In the Projections, we used the Lee-Carter model for the younger generations and combined it with a model that expresses the mortality rate improvement as a shift of the mortality rate curve to the advanced age side (linear differential model) for the older generations, in order to adapt to the mortality conditions of Japan, where mortality rate improvement is notable. Note that the linear differential model describes the difference in the shift of the elderly mortality rate curve in the horizontal direction by a linear function of age.
When projecting the future mortality index, we used data after 1970 in order to reflect changes in the level of mortality that gradually slowed down over the past 40 years. From the perspective of ensuring consistency in terms of the mortality rate of men and women, curve fittings were applied simultaneously for both men and women. For the amount of shift of the mortality rate curve to the advanced age side used in the linear differential model we used the rate of change of the mortality index in the past 15 years to make projections, and fixed the gradient for the future using the latest mean value (covering the past five years).
Because the improvement in Japanese mortality levels for recent years is showing trends beyond the assumptions of existing theory, we judged that the future mortality rate transitions and levels reached will be highly uncertain as in the previous Projections. Therefore, in the Projections, we decided to make multiple assumptions to obtain a likely fluctuation range to the projections. That is, we obtained the distribution of mortality index parameters for the standard mortality rate trend via the bootstrap method and similar, used the distribution to estimate the 99% confidence interval of the mortality indices, and added a “high-mortality” assumption with a high mortality rate, in which the mortality index remains at the upper limit level of the confidence interval, and a “low-mortality” assumption with a low mortality rate, in which the mortality index remains at the lower limit of the confidence interval.
Based upon the parameters and variables obtained through the procedures above, we finally calculated age- and sex-specific mortality rates until 2060 to construct the future life tables. Note that we calculated the life table separately for 2011 to take the effects of the Great East Japan Earthquake into account, using the mortality rate in the Vital Statistics and data on the extent of damage from the National Police Agency and prefectural police departments of Iwate, Miyagi, and Fukushima in our calculations.
(1) Medium-mortality Assumption
According to the standard future life tables, life expectancy, which was
79.64 years for men and 86.39 years for women in 2010, is expected to grow
to 80.93 years for men and 87.65 years for women in 2020, 81.95 years for
men and 88.68 years for women in 2030, and 84.19 years for men and 90.93
years for women in 2060 (see Table 4-2 and Figure 4-2).
(2) High-mortality Assumption
According to the high-mortality assumption, the mortality rate will be
higher, and life expectancy will therefore be shorter, compared to the
medium variant. As a result, life expectancy according to this assumption
will be 81.25 years for men and 87.97 years for women in 2030 and 83.22
years for men and 89.96 years for women in 2060.
(3) Low-mortality Assumption
According to the low-mortality assumption, the mortality rate will be lower, and life expectancy will therefore be longer, compared to the medium variant. As a result, life expectancy according to this assumption will be 82.65 years for men and 89.39 years for women in 2030 and 85.14 years for men and 91.90 years for women in 2060.
4. Assumptions for the International Migration Rate (Numbers)
The trend of international migration is significantly influenced by the advancement of globalization and changes in socio-economic conditions, as well as the policies and regulations concerning international migration. In addition, socio-economic events and occurrence of disasters inside and outside Japan can also bring about great fluctuations in international migration. Recent examples of such incidents include the terrorist attacks in the United States in 2001, the outbreak of SARS (Severe Acute Respiratory Syndrome) in 2002 to 2003, and the Lehman Crisis in 2008. Most recently, the Great East Japan Earthquake in March of 2011 had a significant impact on the immigration emigration of non-Japanese people into and out of Japan as well.
The actual figures show that the trends of international migration rates and numbers are different between Japanese and non-Japanese populations. Additionally, from a demographics point of view, the movement of the Japanese population is influenced by the age structure of the population, but for the non-Japanese population, the relation of their movement with the population size or age structure of Japan is limited. Therefore, in the Projections, we made assumptions on international migration separately for the Japanese and non-Japanese populations and set the figures of the Japanese population based on the net international migration rate and those of the non-Japanese population based on the number of net migrants.
Looking at the actual statistics of international migration, the Japanese population shows a tendency of exits exceeding entries. In addition, the age patterns of the net international migration rate (net migration rate) by sex are relatively stable. We thus obtained the average value of the age- and sex-specific annual net international migration rate of Japanese between 2004 and 2009 (using values for 4 years, excluding the maximum and minimum values for each age), smoothed out the rates to remove random fluctuations, and set the result as the net international migration rate of Japanese for 2011 and onward (Table 4-3 and Figure 4-3).
Looking at the actual statistics of international migration of the non-Japanese
population, the number of net migrants has generally been increasing continuously,
although some irregular fluctuations have been observed. However, quite
recently, a large-scale excess of exits was observed due to the Lehman
Crisis and the Great East Japan Earthquake; the trends of immigration and
emigration of non-Japanese show great fluctuations in a short period of
time. For this reason, we deliberately excluded data from years considered
to show significant temporary transitions due to socio-economic events,
disasters, etc. from our estimation of the number of net migrants of non-Japanese
origin since 1970, projected a long-term trend of the number of net migrants,
and set the result as the assumption until 2030. Note that the impact of
the Great East Japan Earthquake on the excessive emigration is reflected
in the assumptions until 2012. Note also that the sex-specific number of
net migrants of each year was calculated using the average values of the
sex ratio of the number of net migrants from 1970 and onward, and the age-specific
proportion was obtained by smoothing the average values from 1986 to 2010,
for which actual statistics are available (Table 4-4 to 4-5, Figure 4-4 to 4-5). However, in the long run, the scale of international migration of non-Japanese
must be interlocked with the population scale of Japan. We therefore obtained
the age- and sex-specific net international migration rate in 2030 in each
projection (using the total population of Japanese and non-Japanese as
the denominator) and assumed it to be constant thereafter.
IV Auxiliary Projections
We made auxiliary projections for the period from 2061 to 2110, which may
be used as a reference for analysis of long-term population projections.
In these projections, the survival rate-fertility rate, sex ratio at birth,
and international migration rate are assumed to remain constant from 2061
(Table 5-1,Table 5-2,Table 5-3,Table 5-4,Table 5-5,Table 5-6).
Contents

|