The number of households as of October 1 each year was projected for 25 years from 1995 to 2020.
The essential part of the household projection was carried out by household transition method. This method applies the household transition matrix on a population vector by household position to obtain future households by family type.
The results are described by number of households by sex, five-year age group, and family type. Family types consist of gone-person,h gcouple-only,h gcouple-and-child,h gparent-and-child,h and gotherh households.
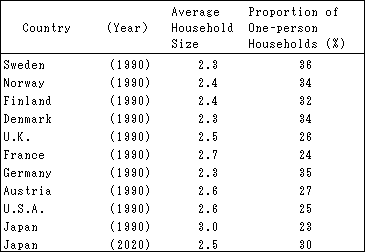
According to population projections for Japan (middle variant) published in 1997, the total population will peak at 127.78 million in 2007, and then start declining. However, the household projection result shows that the number of private households will peak at 49.29 million in 2014, which is seven years behind the population. The number of private households in 2020 will be 48.85 million, or a 4.95 million increase from 43.95 million in 1995.
Figure 1. Number of Private Households

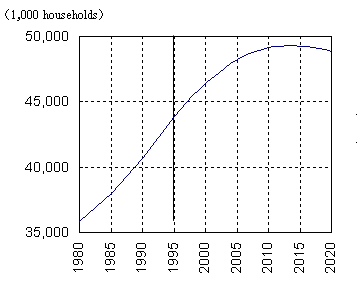
The average household size will continuously decrease during the overall period of the projections. As a result, the average size will decrease from 2.82 of 1995 to 2.49 of 2020. However, the decrease will be slow progressively.
Figure 2. Average Household Size
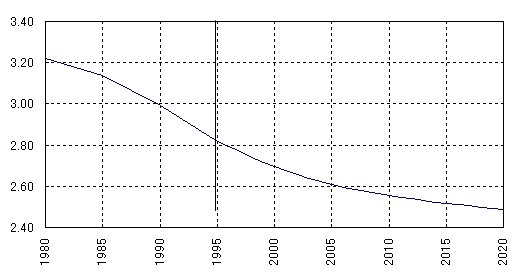
gOne-person,h gcouple-only,h and gparent-and-childh households will increase while gparents-and-childh and gotherh households will decrease. The increase of simple and small households corresponds to the reduction of household size.
Between 1995 and 2020, gone-personh households will increase from 11.24 million to 14.53 million, gcouple-onlyh households from 7.62 million to 10.69 million, and gparent-and-childh households from 3.11 million to 4.62 million, respectively. However, gcouple-and-childh households will decrease from 15.03 million to 13.04 million, and gotherh households from 6.9 million to 5.97 million, respectively, during the same period.
Chart 1. Number of Private Households by Family Type
The number of households with heads aged over 65 years will almost double from 8.67 million in 1995 to 17.18 million in 2020. The increase in gone-personh households is especially prominent while that of gotherh households will decline. The number of gone-personh households with heads over 75 years will increase 3.3 times from 0.92 million in 1995 to 3.06 million in 2020.
Chart 2. Number of Households with Heads Aged over 65 or 75 Years by Family Type
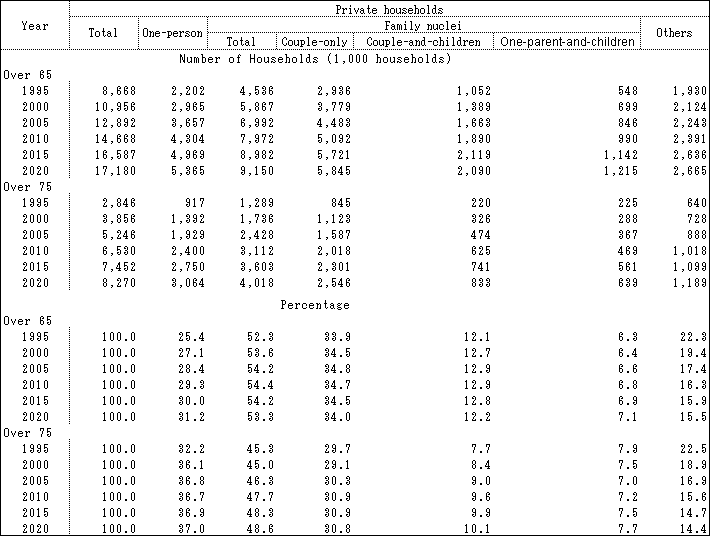
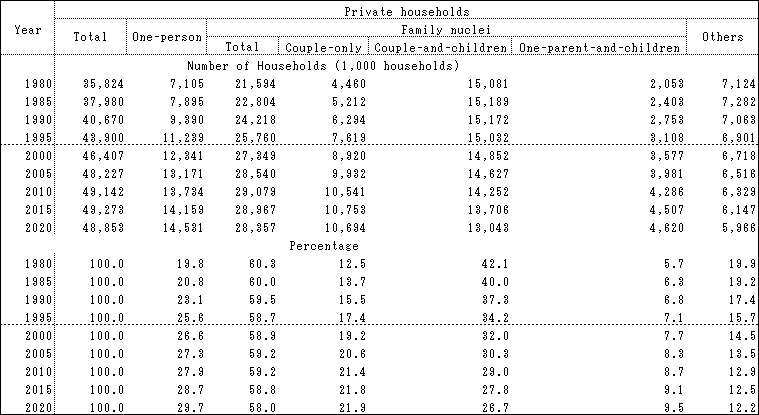
Chart 3. International Comparison of Average Household Size and Proportion of One-person Households
